some ideas and analyzes about FET
Hello everyone,
I am an independent trader with a passion for trading, having analyzed thousands of charts. Today, I would like to discuss some trading opportunities for an altcoin, specifically FET.
In recent days, as you may know, Bitcoin has successfully retested the approximate level of 65,849 (a rough figure) and has surged upwards to reclaim its historical high around 72,000. It is currently in a brief pullback phase, as illustrated in the chart below:
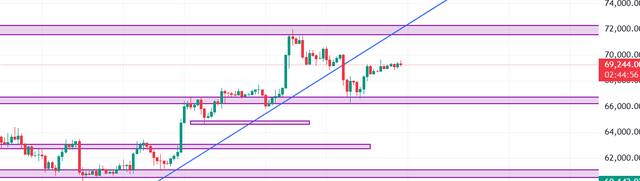
At present, BTC has found support around the 67,000 level and appears to be making its way back towards the 72,000 mark. Although I have yet to see a clear signal indicating a move back to 72,000 from either the main chart patterns or the secondary indicators, from the perspective of support and resistance conversion, I personally believe that a return to the 72,000 high is highly likely.
We know that BTC's movements significantly influence many altcoins. Given that we have roughly determined BTC's overall upward trend, we can also identify some trading opportunities among altcoins. It is well known that altcoins exhibit greater volatility, thus offering larger profit potential. Currently, many altcoins are in a pullback phase following an upward movement. When the pullback ends and support is found, trading opportunities arise.
There are indeed many altcoins with promising trading opportunities, but due to limited time and space, I will introduce one coin today. If possible, I will recommend other coins in the future.
As the title suggests, the coin I am recommending is FET. Here are my reasons:
Firstly, as shown in the 4-hour chart, FET encountered resistance at the 2.7 level and began to pull back, currently trading around 2.26. Its next support level is approximately at 2.16.
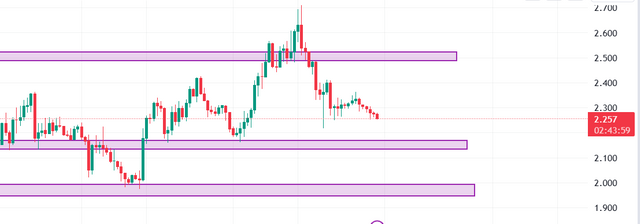
So, is it likely that FET will find support at the 2.16 level? I believe so. Historically, the 2.16 level has served as support multiple times, indicating strong support strength. Additionally, from the 50 EMA perspective, the price initially rebounded and was resisted at the yellow line, then moved downwards and is now gradually moving away from the yellow line. When the price moves too far away from the yellow line, a rebound is inevitable. Furthermore, from the secondary chart (a custom indicator combining RSI and candlestick charts), the red candlestick is still some distance from the green oversold line. Based on my personal experience, when the candlestick chart closes above the green line, a rebound is highly probable. Given the current distance from the green line, this closing position is likely around 2.16.
Therefore, I personally believe that 2.16 is a good trading opportunity for FET. However, market conditions can change, potentially overturning my current hypothesis. Readers should also incorporate their own analysis to make the final decision.
That concludes my analysis of the FET cryptocurrency. If there are other trading opportunities, I will share them with you.