Price Analysis, Jan. 19: Bitcoin, Ethereum, Bitcoin Cash, Ripple, IOTA, Litecoin, NEM, Cardano
 After a sharp fall, the aggressive bulls jump in
and buy at lower levels. This strategy has
resulted in huge gains for the cryptocurrency
traders in 2017. However, unlike previous
occasions, we have not seen a sharp rise this
time. This shows that the traders are not
confident of a huge rally from the current
prices.
In the next few days, we expect a range bound
action in most of the top cryptocurrencies.
BTC/USD
We had expected a pullback from the
$10,704.99 levels. But Bitcoin overshot on the
downside and fell to $9,300 levels.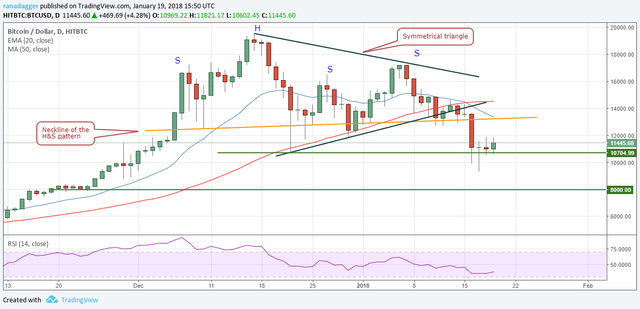 Currently, the bulls are attempting a reversal,
which is likely to carry the cryptocurrency to
the neckline of the head and shoulders pattern
at $13,202 levels.
We expect another round of selling from those
levels, which is likely to sink the BTC/USD pair
back to the support zone of $10,704.99 to
$9,300. If this support zone breaks, a fall below
$8,000 is likely.
On the other hand, if the bulls succeed in
holding the support zone, it will lead to a start
of a new uptrend. Nimble-footed traders can
play the rise, but others should wait for more
clarity to develop.
ETH/USD
We expected the support zone between the
trendline and $940 to hold. On Jan. 17,
Ethereum broke below the trendline and fell to a
low of $770.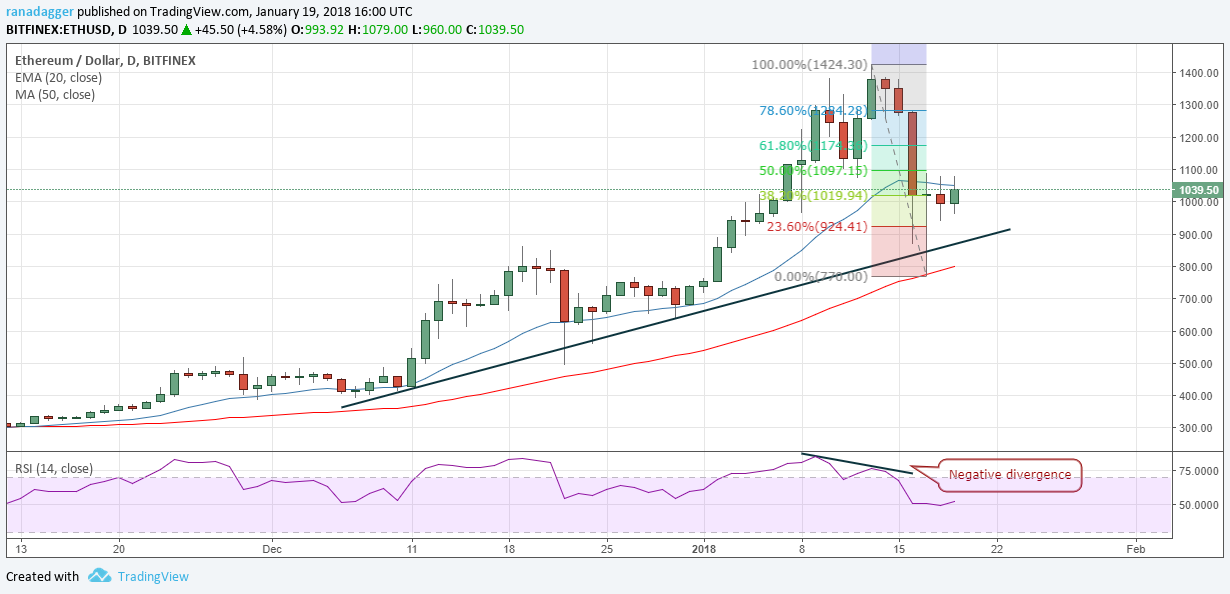 The bulls bought the dip aggressively, which has
resulted in a pullback that carried the
cryptocurrency towards the 50 percent
Fibonacci retracement levels of the recent fall
from $1424 to $770.
For the past three days, the ETH/USD pair has
been struggling to cross above $1097. If the
price breaks out of the $1100 levels, we expect
a move to $1174.36 and $1284.28 levels. As the
stop loss is $930, which doesn’t offer a good
risk to reward ratio, we are not suggesting any
trade on it.
BCH/USD
We expected the $1733 levels to hold. Still, the
bears easily broke through it and Bitcoin Cash
fell to a low of $1364.96 on Jan.21.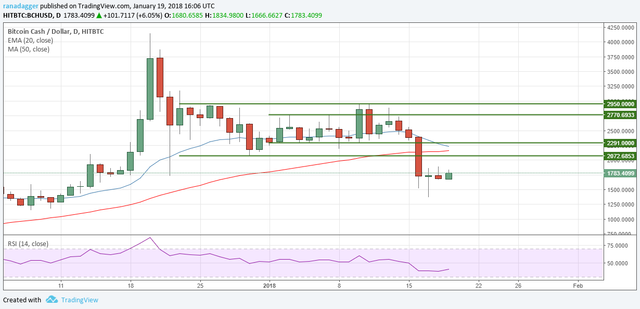 The current increase is likely to face resistance
at the $2072 levels, which was the support of
the range previously. We shall get a
confirmation of a bottom during the next
downturn. If $1364.96 breaks, a fall to $1194 is
likely.
Our bearish view will be invalidated if the BCH/
USD pair sustains above $2072 for a day.
XRP/USD
We had forecast a fall to 61.8 percent Fibonacci
retracement levels of the latest rally, however,
Ripple fell close to the 78.6 percent retracement
levels, which coincided with the lower end of
the descending channel.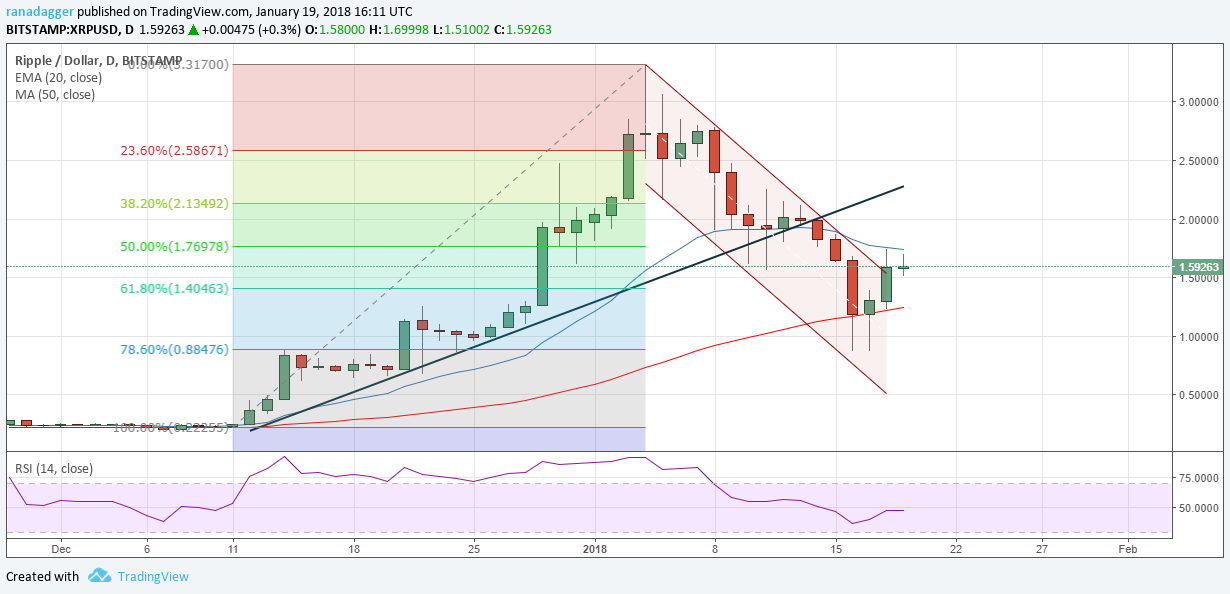 The cryptocurrency has broken out of the
descending channel, which suggests that the
downtrend is over. However, the present
increase is facing resistance at the 20-day EMA,
above which a move to $2.20 is likely. At that
price, the XRP/USD pair will face resistance
from the trendline that had previously acted as
a strong support.
However, if the cryptocurrency fails to break
above the 20-day EMA, the bears will attempt
to resume the downtrend. Support lies at
$0.87.
We expect a few days of range bound trading.
IOTA/USD
IOTA broke down of the bearish descending
triangle pattern on January 16, which gives it a
pattern target of $1.10.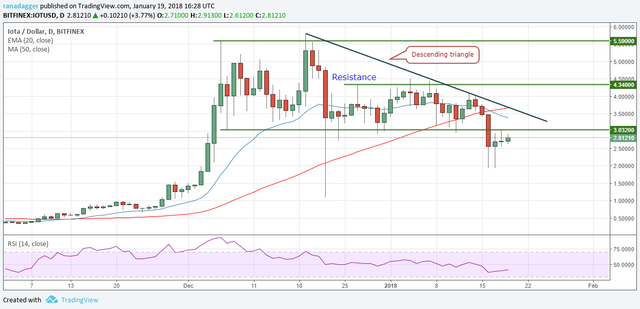 However, the cryptocurrency took support at
$1.93 levels on Jan. 17.
Currently, the IOTA/USD pair is retesting the
breakout levels of $3.032. If the bulls breakout
of the overhead resistance and the downtrend
line, our bearish view will be invalidated.
However, if the bears defend the $3.032 levels,
we are likely to see another bout of selling,
which will retest the lows.
We don’t find any clear pattern; hence, we are
not recommending any trade.
LTC/USD
We had forecast a likely fall to $100 if Litecoin
broke below $175.19. It rose from a low of
$140.00 on Jan. 20.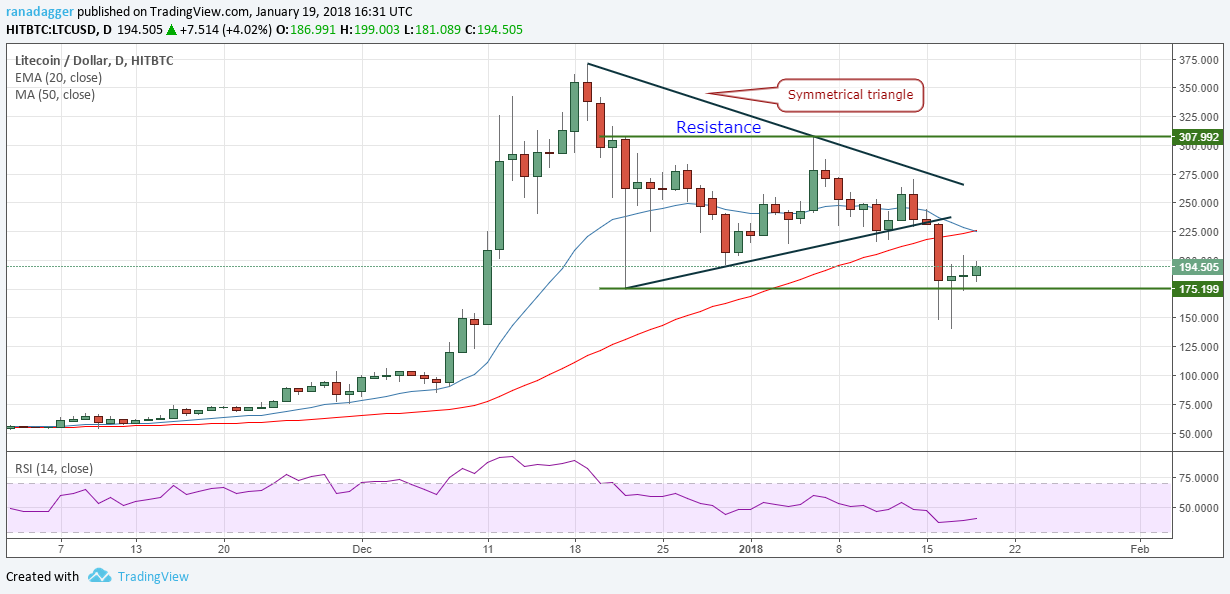 For two days in a row, Jan. 16 and Jan. 17, the
bears broke down below $175.19 but were
unsuccessful in holding prices down.
If the bulls breakout of $205, a move to $225 is
likely, where both the moving averages
converge. This level is likely to act as a
resistance.
We don’t find any reasonable trades on LTC/
USD pair.
XEM/USD
NEM fell close to the 78.6 percent retracement
levels on Jan. 16 and Jan. 17. Thereafter, the
bulls have commenced a pullback, which is likely
to face a strong resistance at the downward
trendline.
If the price moves above the downtrend line, an
increase to $1.45 can’t be ruled out.
The next fall towards the recent lows of
$0.55134 will confirm whether the bottom is in
place or is there further to go.
Until then, we shall remain on the sidelines on
the XEM/USD pair.
ADA/BTC
Cardano broke below the trendline support on
Jan. 16 and Jan. 17, however, the bulls
defended the support and pushed prices higher
quickly.
The ADA/BTC pair broke out of the downtrend
line yesterday, Jan. 18, however, it could not
pick up momentum. It is struggling to rally
above 0.00006. Once bulls breakout of 0.00006,
a move to 0.00007 and thereafter to the
0.00008 levels is likely.
The cryptocurrency pair will become negative
below 0.00004730.
@resteemator is a new bot casting votes for its followers. Follow @resteemator and vote this comment to increase your chance to be voted in the future!