A history of the ICC Rankings
Batting and bowling averages have been around since time immemorial. Since 1793 to be precise, when the Marylebone scorer Samuel Britcher published his “List of all the Principal Matches of Cricket” which included a final page of run aggregates and averages. The concept of bowling averages came later, but still back in the heart of the nineteenth century.
Averages were translatable from the lush outfield of Lord’s to the bumpiest ground in the furthest corner of the cricketing globe. But they did have drawbacks. In 1953 it wasn’t Neil Harvey who topped the Australian tour batting averages but Bill Johnston, who managed to average 102 thanks to only having been dismissed once in 17 innings on tour. In Test cricket, Bradman is trumped by West Indian Andy Ganteaume, who scored 112 in his only Test innings back in 1948.
In the early 1980s two Cambridge University graduates were both working on their own computer cricket simulations based on the “Owzthat” dice game familiar to so many cricket fans around the world. Gordon Vince and Rob Eastaway – then working for Logica and ICI respectively – were both independently devoting their time to develop complex simulations of the sport.
In late 1984, Eastaway found himself in a bar in San Francisco, discussing cricket with a group of ex-pats, and one of them said: “you should talk to this guy called Gordon Vince”. On his return to London, he contacted Vince to discuss reviving his simulation which had been put on hold due to the processing time it took on the mainframe computer at Logica.
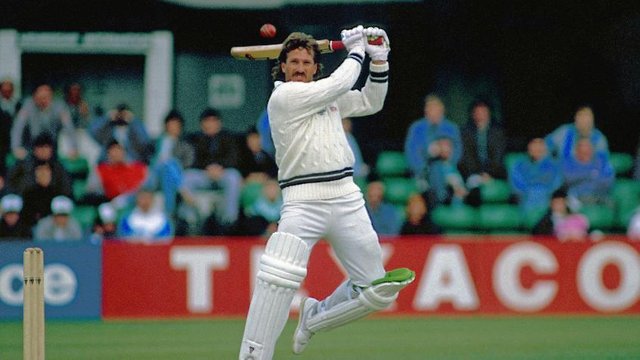
In 1986 Ian Botham was banned for three months, and missed the first Test defeat to India at Lord’s. By then, the simulation was up and running and Eastaway wondered what would have happened had Botham played instead of Derek Pringle. He entered both teams into the program, swapping Pringle for Botham, and within a minute the whole match had been processed. The result looked very plausible: Botham had a decent match, but England still lost.
He wrote it up as a match report and sent it to ‘The Cricketer’ Magazine and the editor at the time - Christopher Martin-Jenkins - responded and it was used as the lead article in the next edition. Reading the article, former England captain Ted Dexter contacted Eastaway - who had just started working at Deloitte a couple of days earlier - to invite him to discuss an idea he’d had.
Rob remembers, “I went for lunch at Ted’s huge house on Ealing Common. After he’d got over the shock that I was some fresh-faced lad just out of university, we went for lunch round the corner and discussed his idea of a rating system. I knew immediately that it would need Gordon’s programming skills, so we arranged a meeting a week later for Gordon and me to talk through the idea with Ted.”
If a new system were to be put in place, it would have to be more sophisticated than an average; a statistic that allowed a comparison of players from different countries; that allowed for the fact that some matches are very high scoring because the conditions are very easy and others are very low scoring. Some innings are played against great bowling attacks and others against attacks that are not so strong. There had to be some way of levelling the playing field so that players could be compared across eras. Lastly, more recent performances should be weighted more highly than those from longer ago.
The system was not meant to supersede averages or to rate a player’s career, but to be seen as a guide to current form. A century in a low-scoring victory against a great team should be valued more highly than one in a high-scoring draw on a featherbed. A bowler should be rewarded more highly for taking Sachin Tendulkar’s wicket than Chris Martin’s.
It took months to develop the program, working evenings and weekends. Whenever a change was made to the algorithm, it took several hours to process. Eastaway’s boss at Deloitte loved the idea of sponsoring the ratings and gave the go-ahead to put their name to them. The launch took place at a hotel next to Lord’s on 17 June 1987, the day before the start of the Test against Pakistan. About fifty journalists attended, and it made headline news the next day.
There were a few early teething problems. Originally it was possible to qualify for a full ranking after just ten innings or taking 30 wickets. Narendra Hirwani took 16 wickets in his first Test in 1988 and shot up to fourth in the bowling table. In addition, a player who missed a match was not penalised, so an injured player could stay high in the ratings for months without doing anything - Carl Rackemann being a classic example.
In early 1988 a significant change was made to both these factors, slowing the new player entry considerably and introducing a penalty for missing a match. Although there have been many small changes since then, mainly in slowing the qualification rate even more, it was the changes in 1988 that were the most significant and the system has changed little since then. Now, Hirwani places 24th after his first Test and never made it higher than 11th.
One of the early advantages of the system, according to Dexter was, “The early recognition of overseas talent, which often remained under wraps, and the considerable accuracy of the Ratings when used to compare the relative strengths of Test-playing countries.”
With the growth in the number of One Day International matches around the world, Eastaway and Vince put their minds to creating a ranking system for that form of the game. Obviously there were different factors to be considered. Batsmen gain credit for rapid scoring and bowlers for economy. Large scores or wicket hauls against weaker nations received much less credit than the same performances against the top-rated sides. The system was subsequently launched in the summer of 1998.
An important change came in January 2005 when the rankings were acquired by the ICC.
Malcolm Speed - then Chief Executive, announced, “We have been looking to develop an official system of player rankings for some time and having studied a range of options we are of the view that these rankings provide the truest reflection of the relative merits of international cricketers.”
As the number of Women’s ODI matches continued to rise, the Women’s ODI Rankings were launched in October 2008. They operate in the same way as the men’s equivalent but with some adaptations reflecting the fact that the scores in women's ODIs tend to be lower, and there are fewer women who play ODIs in a given year than men.
Finally, with the growth of the number of International Twenty20 games around the world, in October 2011 came the launch of the MRF Tyres Player Rankings for that form of cricket.