Copper analysis with COT and Ichimoku data.
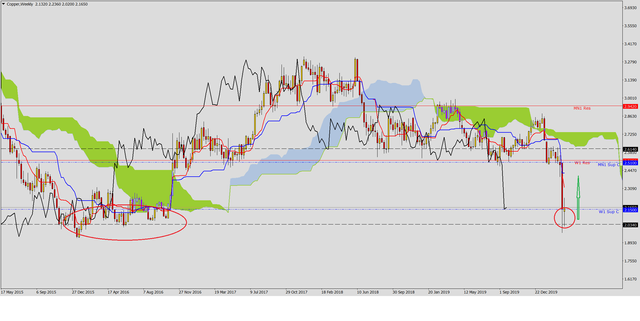
During the last week of trading, Copper prices stopped on a support area touched several times during the year 2016.
On chart W1 it can be seen how the strong drop led prices to move away from the ichimoku averages, leading to a situation of imbalance (chart 1).
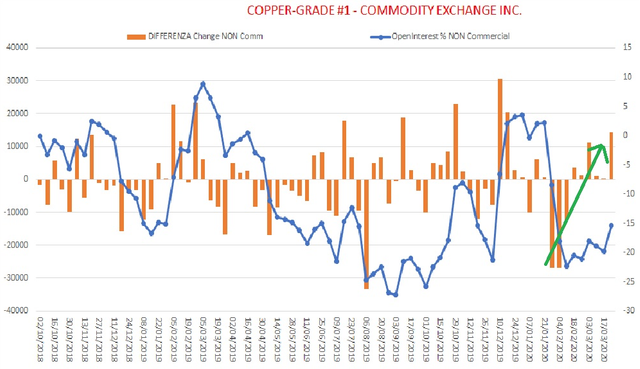
Analyzing the data released by the Cot Report, although the open interest value is still negative (but has been recovering for several weeks after the lows of mid-February), we can see how the difference between the variations of long and short contracts has gone from negative to positive (orange histogram shown)
So these levels can be monitored to look for a possible turnaround that brings prices closer to the tenkan / kijun lines. (Graph 2).
●▬▬▬▬▬▬▬▬▬▬▬▬▬▬▬▬▬▬▬▬▬▬▬▬▬▬▬●
• Personal Links:
► FB: https://www.facebook.com/COT-Analysis-2160376444276025/
► Steemit: https://steemit.com/@nordcaster
► Twitter: https://twitter.com/colombodiego74

