Is it Time to Buy Bitcoin? (March, 2020)
Is it Time to Buy Bitcoin? (March, 2020)
If you find the information in this channel helpful, please share and invite your friends: https://t.me/zettt_trading. Let me know if you'd like to read more of this type of content. My private account is Zettt on Twitter and Telegram. Donations in BTC: bc1q77mmp5uzehkuafkwjcrlah5260895jf0szplsz.
Introduction
I've been checking out some statistics on the Bitcoin network, to see where we are in the cycle. I think one question that all of us occupies is:
Is the bottom in? Are we entering a bull market?
Be prepared to click through a couple of images with this post. My observations say this is an extreme phase we're in. Some metrics print such an extreme signal, it's hard to ignore. But, and that is the important part, there is no clear sign this is the absolute bottom, just yet.
Bullish Signs
Logarithmic Growth Curves aka. The Rainbow Chart
I'll start with the logarithmic growth curve, that is sometimes also referred to as "the rainbow chart". We've fallen out of it. Clearly.
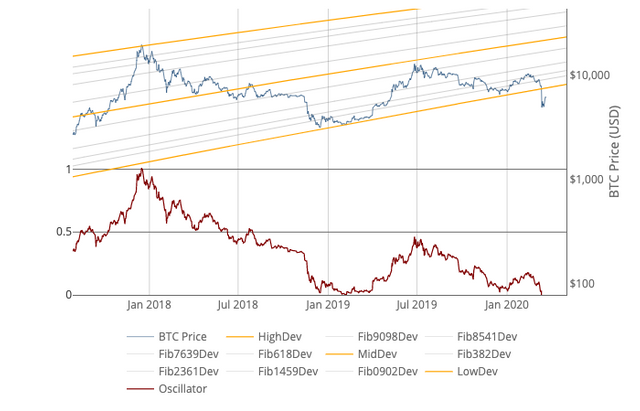
This removes the myth that Bitcoin price adheres to some sort of logarithmic growth, all the time.
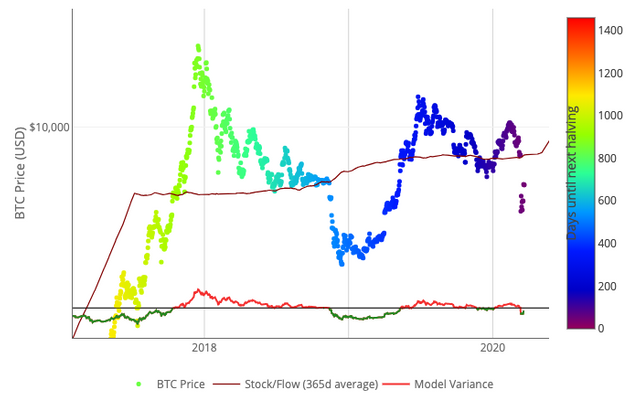
Stock-to-Flow Model
The all beloved Stock-to-Flow is at saying we're extremely undervalued. It hasn't been this negative since 2016, right around the previous halving. This makes me very excited. Normally this would be the signal to go all in--under different circumstances. I'll explain later why this isn't screaming "buy me now".
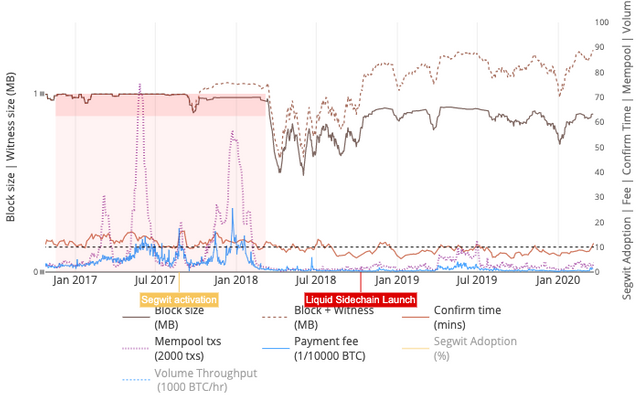
Network Congestion
Now what does the Bitcoin network itself say? The Bitcoin network says that it is processing a lot of transactions right now. As you all may be aware, we're facing a global economic crisis, so it makes sense that Bitcoin has to process more transactions, whether it's people entering, or exiting the market. Usually when the Bitcoin network gets congested, prices go up, because there's no one to trade with on an exchange, because their Bitcoins are stuck (unconfirmed) on the network. I'm regularly checking in on network congestion for my personal use, because I'm actually using Bitcoin. I've seen transactions increasing for a very long time now, and I'm happy to see this now getting more extreme. It means people transact Bitcoin. This is good. I'm not so happy that it gets harder to transact at 1 sat/b anymore so easily, but I'll survive.
HODL
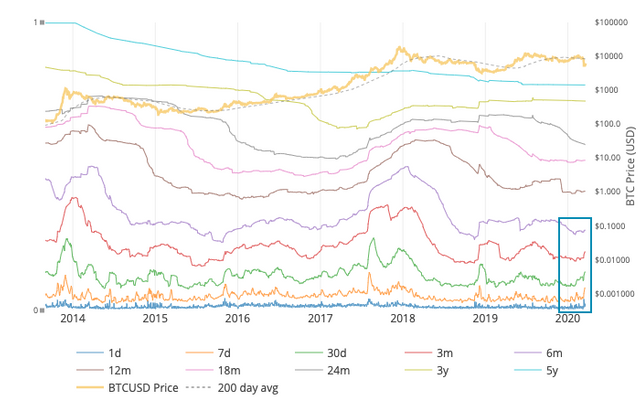
Now here's another extremely good sign. On this last drop to 4000$, there's never been so much new demand entering the space in many years. The HODL Waves statistics below reveal this data:
Bitcoin HODL Waves is a visualisation pioneered by Unchained Capital, it shows the cross section of Bitcoin held in wallets grouped by the age since they last moved. The upper contours, represent supply (old coins that have remained unmoved) while the lower contours represent new demand (coins that have recently shifted). The composite view clearly shows each bull cycle bringing in new demand.
Other Valuations
The most extreme bullish signal I could find is David Puell's Delta Cap valuation model.
The Realised Cap minus Average Cap. Useful for catching the market bottom, and also as a timing indicator for market tops and the start of the bull phase by tracking its oscillation between Realised Cap and Average Cap.
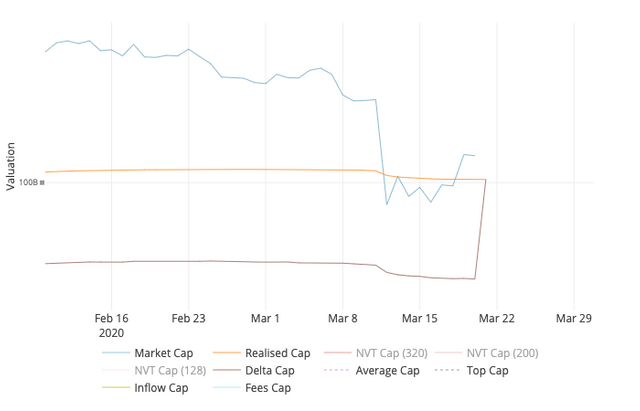
What a giant jump, huh?
Bearish Signs
I'd say I'd go all in without even thinking about it, if there weren't strong counter indications, that this is not the right time to buy just yet. For everyone who caught the bottom at 4k, or the pullback to 4.5k, kudos to you. You're doing well. But you might want to have a stop loss in place, just in case we're going lower.
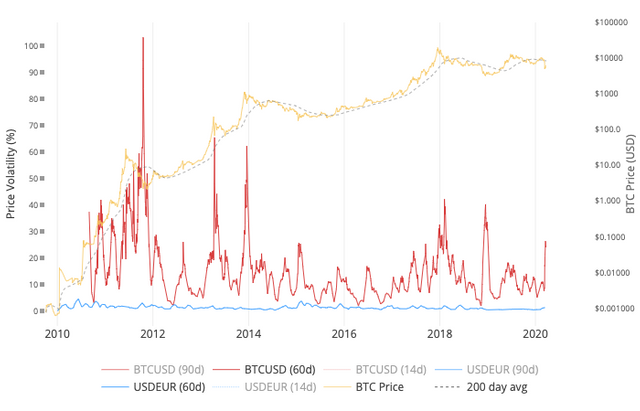
Volatility
First one I'd like to look at is volatility. In terms of historic volatility Bitcoin is not at its extreme yet. According to this chart we're only at 25% volatility. Just as a reference point, the capitulation in 2018 went up to 40%. This means we have still room to go, and other metrics confirm that there's a chance that we might.
2-Year MA Multiplier
One of my favorite, long term, indicators is the 2-Year MA Multiplier. This thing just started printing a buy signal. Looking at the past, when it enters the buy zone, there's enough time to buy Bitcoin. There's no need to rush.
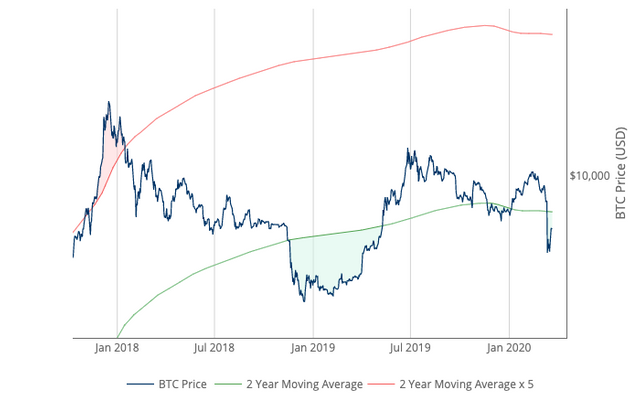
Also notice the way we capitulated the last time. After the big drop, there was a kneejerk run up afterwards, before another final grind down. I'm inclined to believe we are in the phase, where we're trying to go up again, but the market doesn't want to.
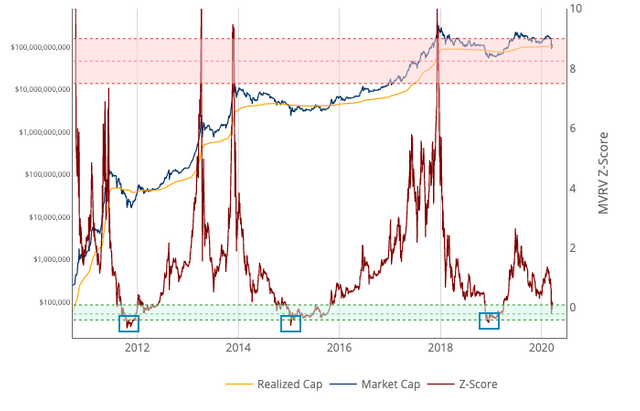
MVRV
Another very good metric is the MVRV Z-Score:
MVRV Z-Score uses blockchain analysis to identify periods where Bitcoin is extremely over or undervalued relative to its 'fair value'.
Note that the best time to buy is when this indicator reaches the bottom edge of the green buy zone.
Miner Capitulation
One more of my personal favorite indicators is hashrate difficulty, or miner capitulation. Basically, whenever the price of Bitcoin goes below what is costs to mine, miners have the option to:
- Mine at a loss, therefore staying in the game, in the hopes the price will go back up again.
- Take out a fiat loan, to keep the operation running. Same argument as above, but with the twist that this loan has to be paid back eventually.
- Turn off miners.
Usually when this form of problem arises, we see a significant decrease in mining hashrate. Many miners have to turn off their machines. A decrease in the hashrate means that Bitcoin will lower the difficulty at which a block can be mined. This adjustment takes time however. During this period fewer blocks are mined, and they take longer to mine. This further adds to network congestion because there are now more unconfirmed transactions waiting to get included in the next block.
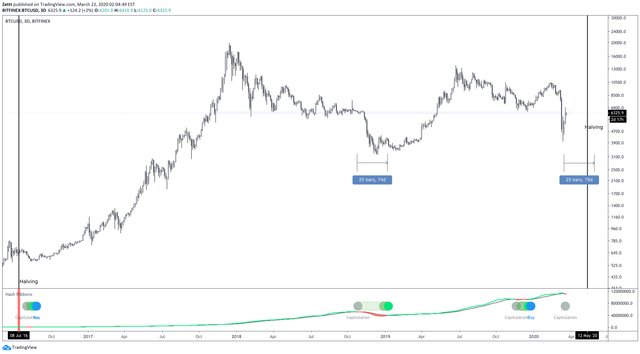
Note that the last time we had such an extreme capitulation, it took 70 days until this specific indicator printed a buy signal. Also note the massive bull run afterwards. I've also included where we would be in about 70 days from now. You can see that this would take us right into the halving time.
I've also included the previous halving in 2016, where this indicator prints a deep red bar because of the sudden drop in supply. The miner capitulation took place after the halving last time.
Conclusion
Is it time to buy Bitcoin right now? No, I don't think it is. I believe the reasons should be very clear by now. We're facing a global pandemic with the Coronavirus. We're facing a recession because of it. This is the first time in Bitcoin's history where this happens, and we don't know how it will react to it. This comes at a time where Bitcoin is also going into the halving, which cuts new supply in half. Under normal circumstances this would be the most and best time to buy Bitcoin in the last four years. However there's nothing in the charts, nor the metrics outlined in this post, to rush your long-term HODL position. I believe we have plenty of room to go lower still. I'm extremely excited what will happen in the coming two months, but, of course, I'm also extremely worried.
If you find the information in this channel helpful, please share and invite your friends: https://t.me/zettt_trading. Let me know if you'd like to read more of this type of content. My private account is Zettt on Twitter and Telegram. Donations in BTC: bc1q77mmp5uzehkuafkwjcrlah5260895jf0szplsz.