Crude Oil Analysis Report 11-10-18...So Much For $82 A Barrel For Oil...Target $54

I last wrote about oil in early October,
I have talked in the past that oil prices are simply a supply and demand equation. One would expect with the largest weekly build of oil year to date would send the price of oil crashing. Yeah, it dropped, but ended the day $1.18, or $76.41 a barrel on the New York Mercantile Exchange.
The macro dynamics for oil haven’t changed, they have just been exacerbated. President Trump's decision earlier this year to withdraw the US from the Iran nuclear deal and re-impose economic sanctions starting in November on the third largest producer of oil is going to create global oil supply challenges.
So when you factor in a strong economic which is in or nearing the last stage of the business cycle, along with oil production constraints, oil prices could go a lot higher than my $82 target.
A lot has changed in only four weeks. U.S. oil prices have fallen more than 20%, since touching a four-year peak in early October to an eight month low and is now in a bear market. To put this into perspective, oil has posted the longest losing streak in over 34 years, falling for ten straight days.
What in the world is happen….literally??? Well, it’s still all about supply and demand, at least that hasn’t changed.
Domestic production rates picked up in anticipation of the sanctions on Iranian crude oil. America is producing a record, 11.6 million barrels / day, resulting in stockpile levels reaching their highest in seven months.
The Market is also rethinking the impact of the waivers offered to several countries, including China, the world's biggest energy consumer. Lastly, when you consider Red October where the equity markets hit correction territory and possibly peak earnings in 2019, the forecast for oil demand has to come down.
I have been watching oil on the charts for the past several weeks and what I see isn’t good for the bulls out there or once bulls out there, like me.
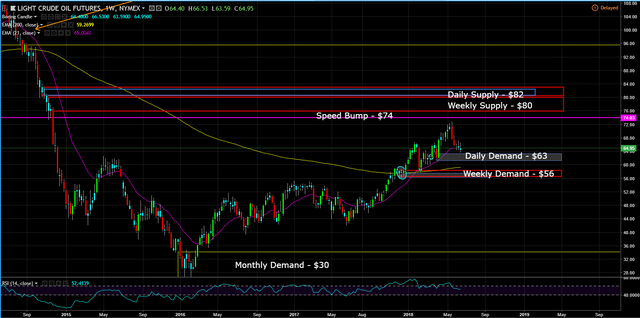
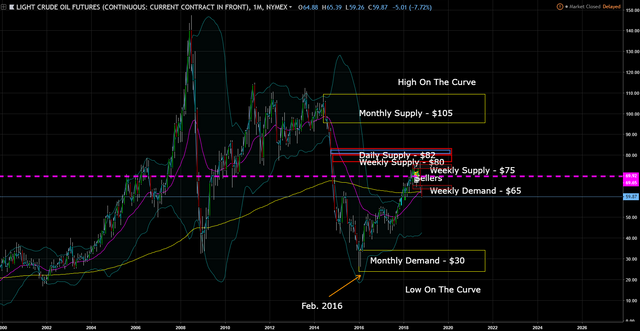
Big Picture
Weekly Chart

Lets get rid of some of these lines.
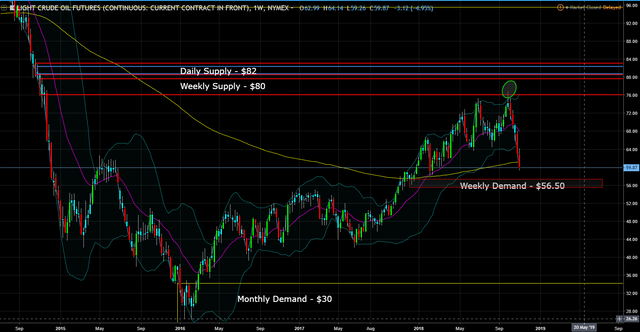
Pretty cool how price hit the weekly demand at $80 and just fell off a cliff, right.
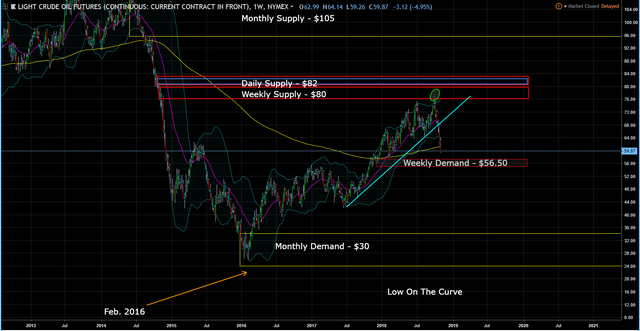
The weekly uptrend line gave us clues that price could go lower.
On the way down price has formed four different daily supply zones, so it's going to be tough for price to get back to the mid $70s again.
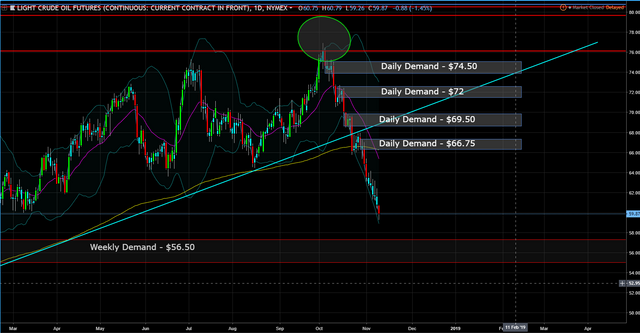
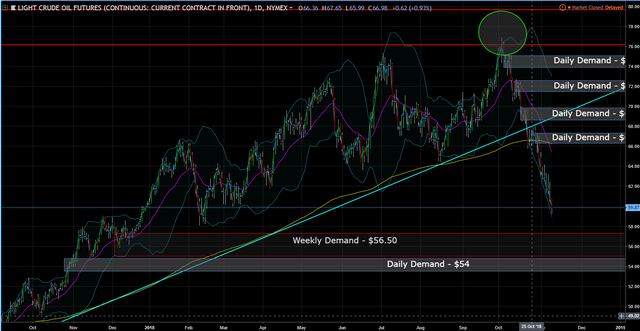
And although oil is oversold, the chart suggest it will get more oversold. The chart suggests there is more downside risks, so pay attention to the $54 level, as that is the floor for oil.
This post is my personal opinion. I’m not a financial advisor, this isn't financial advise. Do your own research before making investment decisions.

Published on

by rollandthomas

Basing in the mid-50s seems feasible here.
If not and that level is breached, it's over, but I think OPEC will cut production before prices drop below the mid 50s.