Ray Dalio Explains What Is "The Most Important Economic, Political And Social Issue Of Our Time"
Reward temporarily declined while I draft a more accurate and complete disclaimer.
I will still be upvoting good comments.
Thanks for your support!
Every quarter, the Fed's Flow of Funds report discloses - among many other things - the total U.S. household net worth, and every quarter for the past two years this number has steadily gone up, hitting fresh all time highs with every new release, most recently $96.2 trillion, to widespread cheers from both the financial press and the public, as well as the administration.
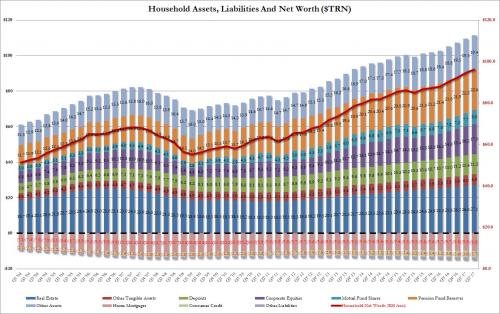
However, as we show every quarter, this aggregate number is largely meaningless in providing a status update on the financial state of the broader US population, as it masks a gaping chasm between the haves, or the top 10% of US society - those who benefit the most from this mostly financial-asset based increase in net worth, and the have nots, or bottom 90%, who remain largely locked out from such gains.
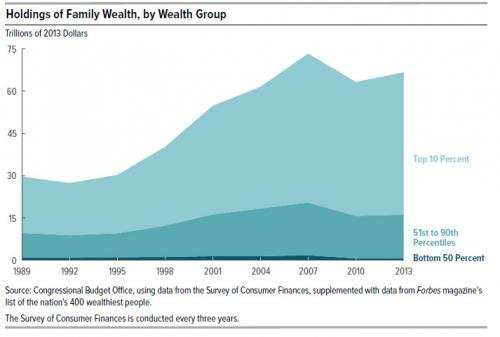
In fact, it was the Fed's own Triennial Survey of Consumer Finances which disclosed just how skewed this net worth distribution had become:
Today, none other than Bridgewater's Ray Dalio focuses on this topic, which he calls "the most important economic, political and social issue of our time", and defines it as "the two US economies"...
I wrote about what I see as the most important economic, political & social issue of our time: The Two US Economies. https://t.co/ZfQR4GgGev
— Ray Dalio (@RayDalio) October 23, 2017
... that of the top 40% and the bottom 60%.
In an article published on LinkedIn this morning, Dalio writes that the Federal Reserve should more closely monitor the economic struggles of the bottom 60% of the economy when making policy since "average statistics" are camouflaging what's really occurring in the U.S., precisely what this site has claimed quarter after quarter.
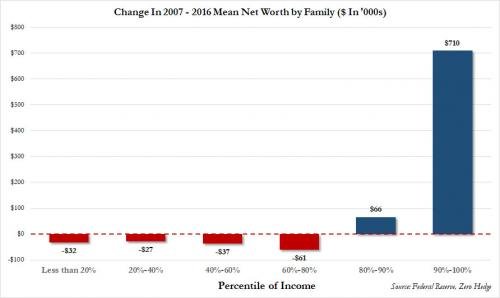
Dalio's argument focuses on the wide disparities in factors including labor, retirement savings, health care, death rates and education between the top 40% and bottom 60% of the country, and how average statistics fail to capture this increasingly bimodal distribution. And, echoing what we said most recently a month ago, the Bridgewater founder said it would be a "serious mistake" for the Fed to just focus on a national average as it could lead the policy makers to see a brighter economic picture than the reality.
Or, as we phrased it, "And there is your "recovery": the wealthy have never been wealthier, while half of America, some 50% of households, own just 1% of the country's wealth, down from 3% in 1989, while America's poor have never been more in debt."
Back to Dalio, who writes in his Daily Observations report that "**because the economic, social, and political consequences of an economic downturn would likely be severe, if I were running Fed policy, I would want to take this into consideration and keep an eye on the economy of the bottom 60%." **He adds that "similarly, having this perspective will be very important for those who determine fiscal policies and for investors concerned with their wealth management."
Dalio hardly breaks new ground when he then writes that the difference in the financial conditions for the two groups - largely due in part whether they can take advantage of the market rally or not, and for most of the US population, it is the latter - is a major cause of slowing growth. Furthermore, the gap between the two economies will only intensify over the next five to 10 years, as changes in demographics will challenge the government's ability to meet pension and healthcare demands, while changes in technology will continue to impact employment.
The disparities he listed include:
- The top 40 percent now has on average 10 times as much wealth as those in the bottom 60, up from six times as much in 1980
- Just a third of the bottom 60 percent saves any of its income, compared to about 70 percent of the top 40
- Premature deaths among those in the bottom 60 percent are up 20 percent since 2000, and the odds of a premature death within that group are twice as high as the top 40
His conclusion: "We expect the stress between the two economies to intensify over the next 5 to 10 years because of changes in demographics that make it likely that pension, healthcare, and debt promises will become increasingly difficult to meet and because the effects of technological changes on employment and the wealth gap are likely to intensify. For this reason, we will continue to report on the conditions of "the top 40%" and "the bottom 60%" separately (as well as on the averages), and we encourage you to monitor them too. "
His full note is below (link):
Our Biggest Economic, Social, and Political Issue The Two Economies: The Top 40% and the Bottom 60%
To understand what's going on in "the economy," it is a serious mistake to look at average statistics. This is because the wealth and income skews are so great that average statistics no longer reflect the conditions of the average man. For example, as shown in the chart below, the wealth of the top one-tenth of 1% of the population is about equal to that of the bottom 90% of the population, which is the same sort of wealth gap that existed during the 1935-40 period.

To give you a sense of what the picture below the averages looks like, we broke the economy into two economies—that of the top 40% and that of the bottom 60%.* We then observed how conditions of the majority of Americans (the bottom 60%) are different from the conditions of those of the top 40%, as well as different from the picture conveyed by the average statistics. We focused especially on the bottom 60% because that's where the majority of Americans are and because the picture of this economy is not apparent to most people in the top 40%.
The Bottom 60% Compared with the Top 40% and the "Average"
We will start off looking at income and the economic picture and then turn to some related lifestyle and political differences.
- There has been no growth in earned income, and income and wealth gaps have grown and are enormous. Since 1980, median household real incomes have been about flat, and the average household in the top 40% earns four times more than the average household in the bottom 60%. While they've experienced some growth recently, real incomes have been flat to down slightly for the average household in the bottom 60% since 1980 (while they have been up for the top 40%). Those in the top 40% now have on average 10 times as much wealth as those in the bottom 60%. That is up from six times as much in 1980.

- Only about a third of the bottom 60% saves any of its income (in cash or financial assets). As a result, according to a recent Federal Reserve study, most people in this group would struggle to raise $400 in an emergency.

- The rates of income and wealth changes of the middle class have been worse than those changes in any of the other groups, once you account for the social safety net and taxes. The charts below show income, adding in the impact of taxes, tax credits, benefits, and transfers (including non-monetary government transfers like Medicaid and employer health insurance). Unlike the picture of real earned incomes shown earlier, all the quintiles had seen some growth until 2008. This was primarily driven by increases in transfers, benefits, and social programs (especially medical benefits). It also lights up some differences within the bottom 60%. Note that while the conditions of those in the bottom quintile of society are terrible, and worse than those of the middle class by most measures (e.g., income, health, death rates, incarceration rates, etc.), the rate of change in these conditions has been worse for the middle class. More specifically, the middle class has experienced less post-tax and transfer income growth than the bottom quintile since 1980 (see chart on the right), partially because government support to the bottom has provided more of a cushion—though in both cases, income growth has been very low.

- The middle class has been especially hard-hit by manufacturing jobs declining about 30% since 1997, which is shown in the below chart.

- Those in the top 40% have benefited disproportionately from changes in asset values relative to those in the bottom 60%, because of their asset and liability mix. The balance sheets of these two groups, shown below, are sharply different. Though the bottom 60% has a small amount of savings, only a quarter of it is in cash or financial assets; the majority is in much less liquid forms of wealth, like cars, real estate, and business equity. For the bottom, debt is skewed toward more expensive student, auto, and credit card debt.

- The increasing disparity in financial conditions is a major cause of the slowing of growth, because those in lower income/wealth groups have higher propensities to spend than those in higher income/wealth groups. Said differently, if you give rich people more money, they probably won't spend much of it, whereas if you give poorer people more money, they will probably spend more of it, each motivated by the extent of their unmet needs and desires.**
- Retirement savings for the bottom 60% are not even close to adequate and aren't much improved as the economy and markets have recovered. Only about a third of families in the bottom 60% have retirement savings accounts—e.g., pensions, 401(k)s—which average less than $20,000. Further, as we do projections of pension finance, it appears unlikely that pension retirement benefits will be fully met.

- Death rates are rising and mental and physical health is deteriorating for those in the bottom 60%. For those in the bottom 60%, premature deaths are up by about 20% since 2000. The biggest contributors to that change are an increase in deaths by drugs/poisoning (up two times since 2000) and an increase in suicides (up over 50% since 2000). The odds of premature death for those in the bottom 60% between the ages of 35 and 64 are more than two times higher, compared to those in the top 40%.
- The US is just about the only major industrialized country with flat/slightly rising death rates.

- The top 40% spend four times more on education than the bottom 60%. This creates a self-perpetuating problem, because those at the bottom get a much worse education than those at the top.

- The bottom 60% increasingly believe others will take advantage of them: the percentage is 49% today versus 40% in 1990.
While conditions for the lowest income groups have long been bad, conditions of non-college-educated whites (especially males) have deteriorated significantly over the past 30 years or so. This is the group that swung most strongly to help elect President Trump. More specifically:
- Now, the average household income for main income earners without a college degree is half that of the average college graduate.
- The share of whites without college degrees who describe themselves as "not too happy" has doubled since 1990, from 9% to 18%, while for those with college degrees it has remained flat, at around 7%.
- Since 1980, divorce rates have more than doubled among middle-age whites without college degrees, from 11% to 23%.
- Prime working-age white males have given up looking for work in record numbers; the number of prime-age white men without college degrees not in the labor force has increased from 7% to 15% since 1980.
- More broadly, men ages 21 to 30 spend an average of three fewer hours a week working than they did a decade ago; most of that time is spent playing video games.
- The probability of premature death for whites without college degrees between the ages of 35 and 64 is nearly three times higher than it is for whites with college degrees, and the rate of premature deaths is up by about 25% since 2000 (while it is down for virtually every other demographic group). The US white population is unique among large groups in the developed world for seeing increases in their death rates. Below, we show premature deaths among working-age whites between the ages of 35 and 64. Again, the average obscures the picture. America's non-white population isn't seeing such a rise in premature deaths.

The polarity in economics and living standards is contributing to greater political polarity, as reflected in the below charts.

It is also leading to reduced trust and confidence in government, financial institutions, and the media, which is at or near 35-year lows.

In Summary
Average statistics camouflage what is happening in the economy, which could lead to dangerous miscalculations, most importantly by policy makers. For example, looking at average statistics could lead the Federal Reserve to judge the economy for the average man to be healthier than it really is and to misgauge the most important things that are going on with the economy, labor markets, inflation, capital formation, and productivity, rather than if the Fed were to use more granular statistics.
That could lead the Fed to run an inappropriate monetary policy. Because the economic, social, and political consequences of an economic downturn would likely be severe, if I were running Fed policy, I would want to take this into consideration and keep an eye on the economy of the bottom 60%. By monitoring what is happening in the economies of both the bottom 60% and the top 40% (or, even better, more granular groups), policy makers and the rest of us can give consideration to the implications of this issue. Similarly, having this perspective will be very important for those who determine fiscal policies and for investors concerned with their wealth management.
We expect the stress between the two economies to intensify over the next 5 to 10 years because of changes in demographics that make it likely that pension, healthcare, and debt promises will become increasingly difficult to meet (see "The Coming Big Squeeze") and because the effects of technological changes on employment and the wealth gap are likely to intensify. For this reason, we will continue to report on the conditions of "the top 40%" and "the bottom 60%" separately (as well as on the averages), and we encourage you to monitor them too.
Robert Kiyosaki is a writer who is just talking about these changes. Ever since President Nixon, in 1971, passed a law that the dollar can be printed without cover, the middle class becomes poorer and the rich become even richer.
The Fed and other institutions serve only to help the rich, they are private institutions in the hands of powerful people. Social, health care - there is no money in the support budget - that's why the money is printed, and the debt - deflation is suppressed by inflation. At one point this balloon will crack.
The analysis of 60 - 40% is excellent, but for a good life and excellent economy of the country it takes much more than that.
It is necessary that smart and honest people make a turning point of the joint forces. I hope that robbery will stop at a certain moment - people should live. It does not matter whether people are white or black, yellow - we are all human beings. Thank you for the useful information - there's really a lot to learn from them @zer0hedge
Rewards are enabled on this post.
Mistake, since people have started commenting on it, I'll just flag it.
The other aspect to this in the next 5-10 years is the advancement of technology. This is going to favor the wealthy and elite at a much greater percentage. While jobs are lost due to automation, the profit margins of the top 1000 corporations is going to skyrocket. This will bode very well for those who own stock, ironically that top percentage everyone is talking about.
The average person is going to see what is left of his/her non-rising income go away. Technology is already starting to penetrate white collar sectors like financial where high paying jobs are being eliminated.
It will be interesting to see how long the politicians can keep up their mantra about bringing jobs back (which isnt going to happen).