MOVING AVERAGE CONVERGENCE DIVERGENCE (MACD)
This article is written by Benedict Raphael (CoinEx Ambassador). This article is written in light to broad the knowledge of our users on some of the tools to use while doing technical analysis. This is an opportunity to learn and know what Moving Average Convergence Divergence (MACD) is all about.
Doing technical analysis as a trader is very paramount because it helps you to carry out price forecasts by checking the historical market data which will guide you on how you should trade. It also helps you to identify good trends and advantageous trading opportunities. I have started showing you guys some basic education of Technical analysis in my past article but today, we are going to look at "Moving Average Convergence Divergence (MACD)
WHAT IS MACD
The Moving Average Convergence Divergence (MACD) is an wavering indicator that is commonly used by traders for technical analysis. MACD is a trend-following indicator that shows the average movement relationship between the price of two digital assets. MACD are usually used to determine the momentum cryptocurrency or other digital assets.
ORIGIN AND USEFULNESS OF MACD
This tool was developed by Gerald Appel in 1970, every since then, MACD principle has been upgraded and it has been using it to measure the market momentum and probably to locate the price trends. The MACD is used by cryptocurrency traders to sight the potential entry and exit points. The Moving Average Convergence Divergence helps traders to understand if the bearish or bullish movement in the price of a particular digital asset is strong or weak. You can use MACD to know the strengthening or weakening points of a bearish or bullish movement of a market.
For us to understand how to use MACD, we must know some certain terms.
Moving Average (MA)
MA is simply a line that regards as the average value of preceding data during a predetermined period. The Moving Average is further divided into a "Simple and Exponential Moving Averages. The Moving Average is an indicator essentially used for technical analysis. The Simple Moving Average has an abbreviation of 'SMA' while the Exponential Moving Average also has 'EMA' as abbreviation.
SMA : Simple Moving Average measures all input data equally
EMA : Exponential Moving Average measures the most current data values.
Understanding the above terms and concepts will give us more insight about the mechanism of MACD and how to use it.
.png)
HOW TO CALCULATE MACD
Generally, Moving Average Convergence Divergence (MACD) is calculated by subtracting the 26-period Exponential Moving Average from the 12-period Exponential Average;
26period EMA minus 12period AMA
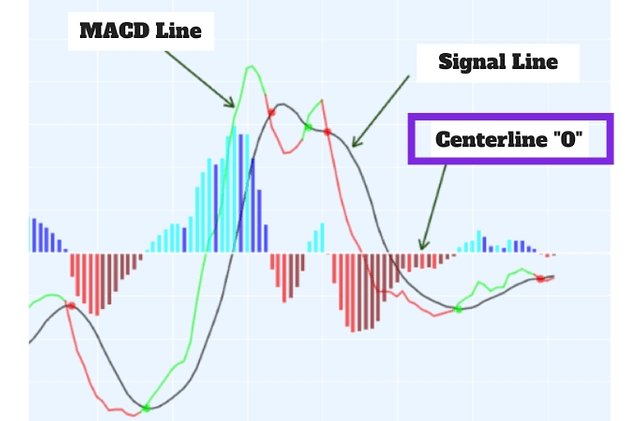
ELEMENTS OF MACD INDICATORS
The zero line indicator has some elements rotating around it. These are MACD line, signal line,and the MACD histogram. So let take a look at each one after the other.
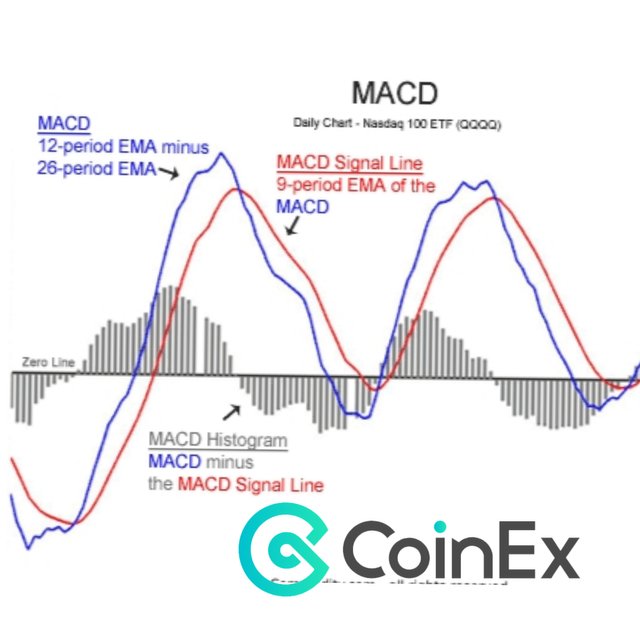
The MACD line
The MACD line helps ascertain the ascending or descending momentum of the market trend. The MACD line is determined by subtracting two Exponential Moving Averages.
MACD line = 12period EMA - 26period EMA
Broadly, the EMA is calculated based on the closing prices of a digital asset. So as for the case MACD line which is measured by subtracting two EMA, the periods used to calculate the two EMAs are usually set as 12 periods and 26 periods. The 12-period is faster while the 26-period is slower. The 12-period and the 26-period I am talking about here could be in seconds, minutes, hours, days, weeks, months or years. So the period you choose will be determined by the trading strategies you want to use.
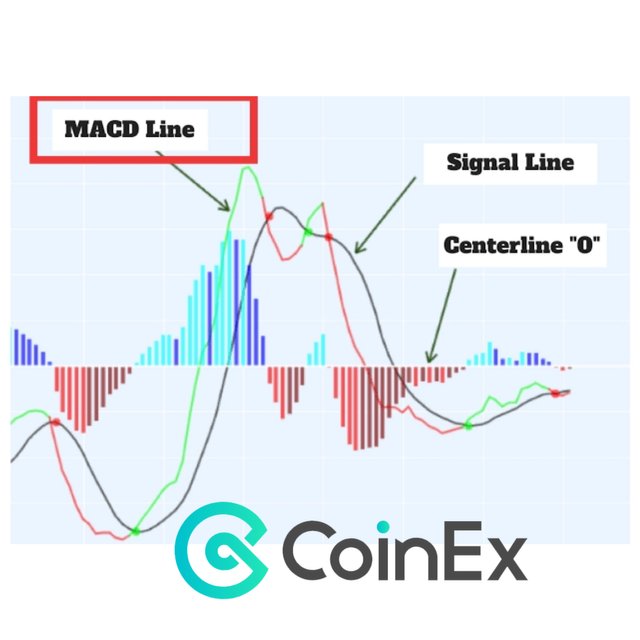
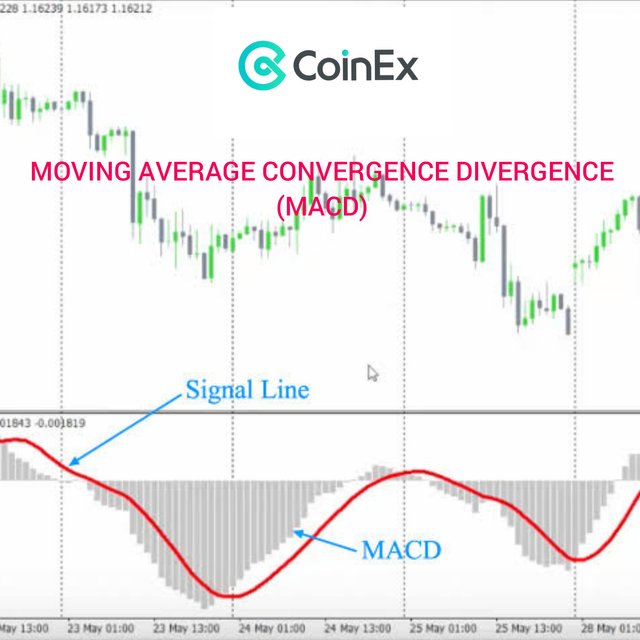
The Signal Line
The signal line is one of the element of zero line indicator, it is usually term as the 9-period EMA of the MACD line;
Signal Line = 9d EMA of MACD line
The signal line is measured from a 9-day EMA of the MACD line. The Signal Line is usually mapped on top of the MACD line, and the line usually makes us spot the potential of either to enter or exit a trade. However, the scenario is not always constant nor accurate, but it most a time goes that direction.
For the sake of a newbie reading this article, 'entry' means to buy while 'exit' means to sell.
The MACD histogram
The MACD histogram is a graphical representation of the convergence and divergence of the MACD line and the Signal Line. The histogram is measured based on the differences between the MACD line and the Signal Line. It shows the visual record of the relative movements of the two lines. Simply put, Histogram is gotten by subtracting the MACD Line from the Signal Line;
MACD histogram = MACD line - Signal Line
One key point about Histogram chart is that it has no issue of concern with the trading volume of the digital assets.
Summary of How MACD Works
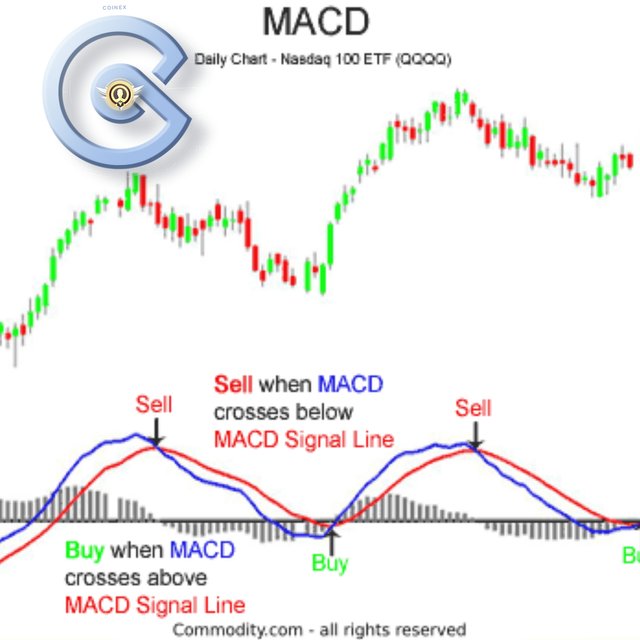
The MACD indicators are developed by subtracting two Exponential Moving Averages in order to build the main line called the "MACD Line". The MACD Line is then used which is then used to compute another Exponential Moving Average that means the Signal Line. Furthermore, the MACD histogram which happened to be the differences between those MACD Line and Signal Line do oscillate above and below a centerline (zero line). When the MACD crosses below the signal line, it means a bearish signal and that tells you that it is time to sell. Contrarily, when the MACD moves above the Signal line, the indicator indicates a bullish signal, and it tells you that it is time to buy.
Constraint of MACD
There are limitations with the divergence of MACD. One of the issues with divergence is that it sometimes shows a possible reversal, meanwhile if you check it very well, you will discover that nothing like reversal occurs. This means the divergence so generate a false positive.
Another limitation of divergence of MACD is that, most times, divergence does not foretell all reversals, i.e it does not forecast all reversals. What I mean by it does not forecast all reversals is that divergence do often forecast too many reversals that never occur.
How to Read MACD Charts
The Moving Average Convergence Divergence indicator is used to trace the correspondence between two moving averages. The relationship between the two lines are termed 'convergent' or 'divergent'. Convergent when the lines tend toward one another and divergent when they gravitate apart. The MACD Signals do
Still, the relevant signals of the MACD indicator are associated with what they term 'crossovers'. So to obtain a relevant signal, the MACD line should either cross below or above the centerline, and the MACD line should cross below or above the Signal Line.
Let understand what Centerline crossovers and Signal line crossover is all about!
Centerline crossovers
Centerline crossovers occur when the MACD line proceeds either on the negative area or on the positive area.
If the MACD line moves above the centerline, it indicates that there is positive MACD value and it means that the 12-period EMA is greater than the 26-period EMA. The positive MACD line forecast a stronger upside momentum.
Meanwhile, if the MACD line moves below the Centerline, it also indicates that there is negative MACD value and it means that the 26-period EMA is greater than the 12-period EMA. The negative MACD line a shows a stronger drive to the downside.
Signal line Crossover
If the MACD line indicator moves above the signal line, it indicates that there is an 'entry' point. It means that is the period traders should buy. Meanwhile, if the MACD line indicator moves down the signal line, it indicates an exit point, i.e is the period traders should sell.
MY ADVICE FOR CRYPTOCURRENCY TRADERS
In a volatile asset like cryptocurrencies, both the centerline and signal line crossovers do occur in a multiple way and it can generate trickish and erroneous signals. So my advice is that a cryptocurrency trader should not depend on MACD indicators alone, rather he should compare it with other technical analysis mechanisms. When doing your technical analysis about a market, try and combine the MACD indicator with RSI indicator. This will help you to reduce the risk of uncertainty and fluctuating signals.
In summary, using MACD is very simple to interpret, as a trader, you should buy once the MACD crosses above its signal line and sell once the MACD crosses below the signal line. The speed of the Crossover indicates either the market is overbought or oversold. Once the line is above the Signal line, speedy Crossover means that there is overbought, while once the line is below the Signal line, the speedy Crossover means there is oversold. A good trader should be able to wait for Crossover to occur fully before taking a step on how to trade. Wait for the MACD line to cross above or below fully before taking a step. Doing this will help you to reduce the risk of faking out.
For you to be a good trader, try and learn how to do technical analysis, and Moving Average Convergence Divergence (MACD) indicator is one of the best tools to use because it can easily identify the market momentum or market trends, but you should not depend on it 100%.
At CoinEx, there are numerous opportunities to gain all the basic knowledge you need in order to be a good and profitable trader. Join us today at CoinEx and start enjoying free knowledge about cryptocurrency, trading, and other related topics.

About CoinEx
CoinEx is a global and professional cryptocurrency exchange service provider founded in 2017. CoinEx is the best trusted, reliable, secured and fastest cryptocurrency exchange in the crypto industry right now. The exchange offers services to more than 100 countries/regions supporting multiple languages. On CoinEx, spot, perpetual, margin and other derivatives readings are all available on the exchange.
Check it out!
You can follow them on Twitter here and also join them on Telegram
Thank you all for reading!