Day 3 ~ Normal Distribution : Taming the Random
Day 3
This my third post on the 100 days of learning challenge I set myself . You can read more about this years goals here.
On Day 1 I looked at a random walker, a small dot that moved across the screen based on a number between 0 - 3.
Although It worked, It didn't move in a way that seemed natural. It was, well, too random.
Wouldn't it be great to generate sets of numbers that seem more naturally distributed.
Well, it just so happens that is possible to do so.
Gaussian Distribution
In reality things are not totally random.
Height is a good example of this.
Say we are looking at the heights of cacti.
       `""',
      ;' ` ;
      ;`,',;
      ;' ` ;
 ,,,  ;`,',;
;,` ; ;' ` ;   ,',
;`,'; ;`,',;  ;,' ;
;',`; ;` ' ; ;`'`';
;` '',''` `,',`',;
 `''`'; ', ;`'`'
      ;' `';
      ;` ' ;
      ;' `';
      ;` ' ;
      ; ',';
      ;,' ';
  dwb\|/\|/;\|/
With the random approach cactus height between 1 - 100 would eventually end up like this:
|
|
|_____________________
|
|
|_____________________
0            100
That's because each number has an equal chance of being picked.
That doesn't really reflect reality as there would be more cacti around the middle or the mean like so:
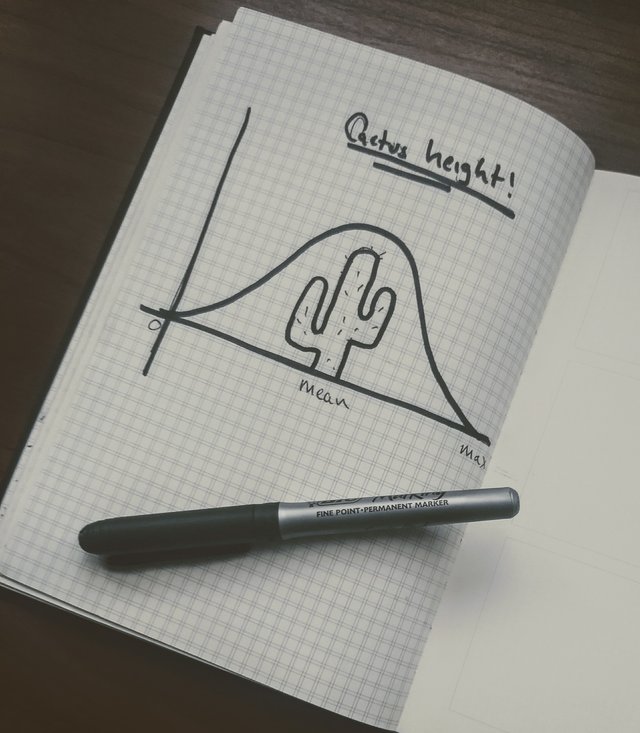
Apparently you can enhance the look of a graph by putting a pen across the page you just drew on.
That's more like it, a lot more around the mean and a few outliers.
This would be an example of a normal distribution, a mean of 50 and a standard deviation of 2.
How to calculate standard deviation see figure 1.4.
How does standard deviation look:
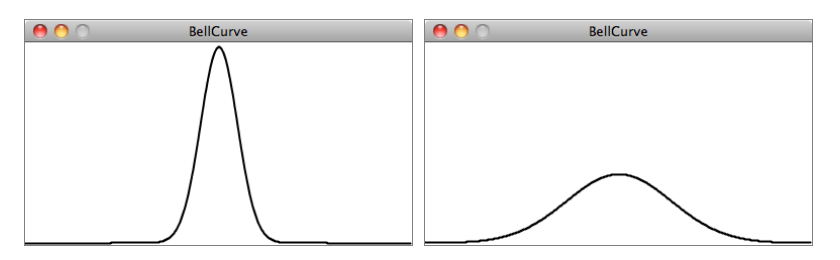
The larger the standard deviation the shallower the curve, in the pictures above the left image would have a lower standard deviation that the right picture.
Let's apply these ideas to code:
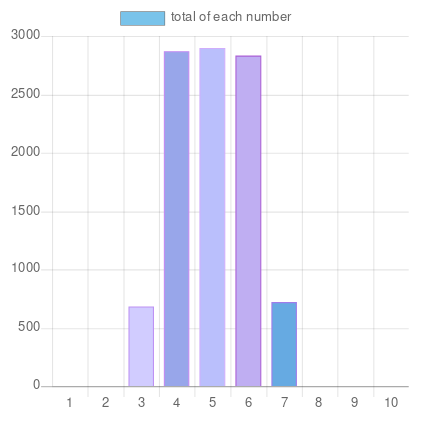
See the Pen Normal Distribution by Adam Harpur (@harps116) on CodePen.
In this example I generated a random sample of 10,000 numbers between 1 - 10 with a mean of 5 and standard deviation of 1. This set is then plotted on a graph. As you can see our chart behaves as expected with most of the numbers hovering around the average of 5 and less around 1 and 10.
I added some comments and references to the code so it's worth checking out if you'd like see how everything works together. You can also open your console ( ctrl + shift + i and click the console tab to see the logs ).
Feel free to change the labelled values around to see how the chart grows and shrinks. Decreasing the standard deviation will create more numbers closer to the mean. Increasing the standard deviation will create more numbers towards the max high and low.
Thanks for reading && happy coding!
Check out Daniel Shiffman's great series on the Nature of Code, this 100 days of learning is a great excuse for me to finally work through the lessons and take some notes as I go.
Cool!
When I've taught things like Standard Deviation in the past I've described it as a measure of consistency, or of how spread out the middle chunk of data is. We teach lots of measures of consistency as we go through school level maths, gradually increasing in their sophistication. For instance we do range, then inter-quartile range and then standard deviation all in an attempt to discern the same thing.
An example: If we are company selling boxes of matches we might put on our boxes that each box has an average (meaning the mean) of 80 matches in it. If we had a competitor that also made boxes with 80 matches in then it might seem that there was little to choose between the two companies.
However if our company's boxes almost always had 79, 80 or 81 matches in and our competitor's had anything from 70-90 matches in, then we would have a much more consistent product, and a much smaller Standard Deviation in the number of matches per box.
Standard Deviation also lets us do other stuff, but at it's core it boils down to this.
That's a great way to think about it and a nice example. I switched off in math in high school and kind of slipped through the cracks. Since learning how to program I've really started to see how mathematical concepts are a very powerful tool to have and I've really enjoyed applying them to code. I'm hoping to look at Perlin Noise next week. Math is a beautiful thing and I'm glad I'm rediscovering it.