Return to consolidated zone first
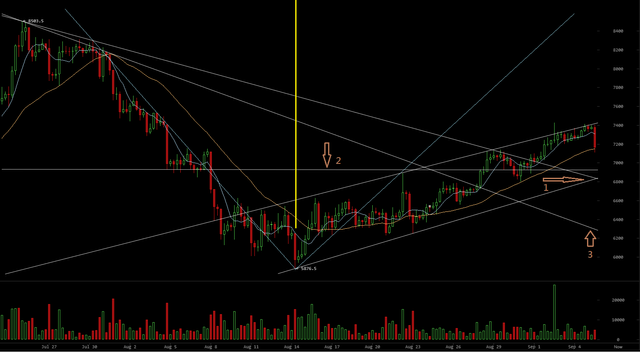
Falling sharply from 73xx to breaking again 7000 is a sign of negative mood dominant the weak rebound period. The horizontal line is arrow 2 a tester of strength or upward force power indicator to helping identify momentum movement.
After couple of hours, then come back checking again and see what really happens and try to catching entering point. Take a look, Arrow 1 is a critical point at 6810 and this position also is the bottom of upward channel. If price breach again that means rebound is over and retest one more time 5800/5700 but before that the first supporting position around 6300 and also pretty closed to the consolidated zone. Seeing what the price fluctuation is in that region a day after later then confirmation the rebound period is ended.
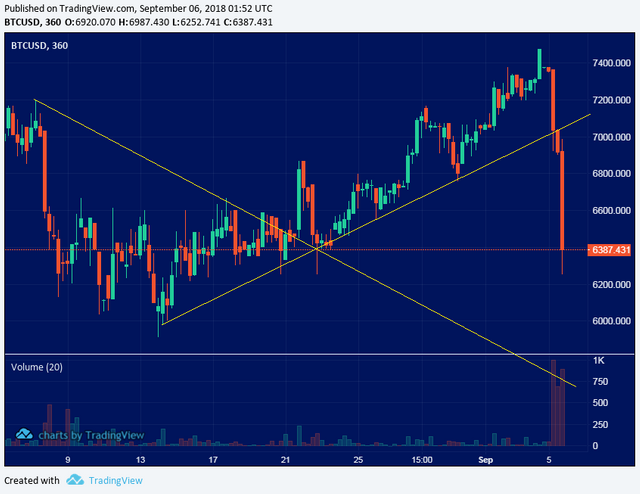
The yellow line as a neutral center shows left-hand side is downtrend track and right hand side is rebound track clearly pointing out one simple fact, bitcoin price still in the correction vortex seeming not enough force pushing to escapes or changing to pattern at all.

That's what i say the dropping by again at the consolidated zone (6300), after that it will retesting 5700/5800. Last night suddenly dropping to create an symmetry pattern is it!