Quick R Tutorial – How to Plot Sigmoid Function using R? 如何用R语言画Sigmoid函数?
The R programming language is designed for statistic computing, and has drawn much attentions due to the emerging interests of Big Data, Data Mining and Machine Learning. It is very similar to Matlab and Python, which has a interactive shell where you type in commands to execute or expressions to evaluate (like a intermediate calculator). You can also save the scripts in *.R script files.
R is best for statistics computation, and it is free, very lightweight (the install package is smaller than 70MB). It can be run on multi platforms e.g. MAC, windows, or linux. This tutorial will guide you through the very quick example of plotting a Sigmoid function using R.
以前听说过R语言不过不是很感冒, 因为很多事情都能用Python或者是Matlab搞定, 并不需要特别去再学一门语言. 最近在做大数据分析/数据挖掘, 又听说了这门语言, 于是感到很有意思就下载了下来玩了一下.
R语言很轻巧 安装包只有70M, 免费的, 在Linux, MAC 和Windows 下都可以运行(并且有64位的版本). R语言和Python, Matlab很像, 特别是装完启动后都会有一个交互式的界面, 这时候你输命令或者表达式就可以立马看到结果. 当然也有一个脚本编辑器可以把长一点的R语言脚本编辑另存为 *.R 扩展名.
R语言是属于统计学领域(天生具有统计基因), 据说是学统计领域的人(并不是专业编程人员)设计的, 所以可能性能上并不能和Python, Matlab 相比(不如软件工程师编写的软件那么健壮). R语言的思维和传统编辑语言不太一样, R结合了很多数学, 概率, 统计的基础知识. 初学起来有一定门槛, 但是并不难. 可以对照着Python等来学习.
接下来就介绍如何用R语言来画数学中的Sigmoid函数. Sigmoid函数也称S函数(因其长得像S形). S函数可用于将数学中的变量重新映射到0和1期间. 该函数数学定义如下:
The Sigmoid function in mathematics is defined as:
在R语言中可以通过以下语法来定义:
and we can define a function in R.
sigmoid = function(x) {

   1 / (1 + exp(-x))

}
That is it! Like powershell, the last expression is the return value of the function (there is no return keyword like C/C++!) and you don’t need to explicitly define the parameter type. Now, let’s make input x a discrete vector that have values separated by step 0.01 between -5 to 5.
其中等于号也可以换成 <- (小于+减号, 语法糖). R语言中数据类型不需要定义类型, 并且函数返回值是函数的最后一个表达式(这点和Powershell是一样的, 没有return语句). 定义函数后我们可以用以下来生成-5到5期间的离散点(间隔0.01), 存储成向量.
x <- seq(-5, 5, 0.01)这时候x的值为:
It is easy to understand that the parameters for seq function is start, stop and step. What x contains now is:
[1] -5.00 -4.99 -4.98 -4.97 -4.96 -4.95 -4.94 -4.93 -4.92 -4.91 -4.90 -4.89

  [13] -4.88 -4.87 -4.86 -4.85 -4.84 -4.83 -4.82 -4.81 -4.80 -4.79 -4.78 -4.77

  [25] -4.76 -4.75 -4.74 -4.73 -4.72 -4.71 -4.70 -4.69 -4.68 -4.67 -4.66 -4.65

...

...

 [985]  4.84  4.85  4.86  4.87  4.88  4.89  4.90  4.91  4.92  4.93  4.94  4.95

 [997]  4.96  4.97  4.98  4.99  5.00
最后我们只需要通过 和Python, Matlab 一样的 plot(x, y) 函数来画图.
Now, you can just plot it (very similar to the plot function in Python and Matlab).
plot(x, sigmoid(x), col='blue')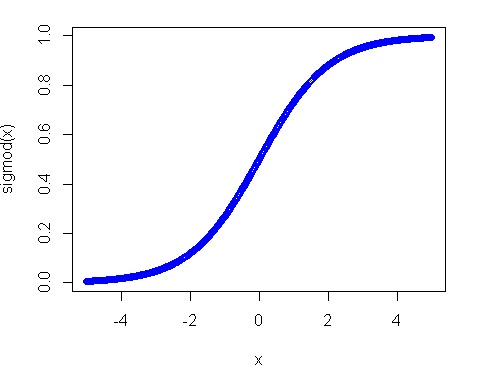
The Sigmoid function is also known as the S function (it has shape of S). The function can be used to map values to (0, 1) so the input can be from negative infinity to infinity. The Sigmoid function is used in the Logistic Regression.

Thank you for reading my post, feel free to FOLLOW and Upvote @justyy which motivates me to create more quality posts.
非常感谢阅读, 欢迎FOLLOW和Upvote @justyy 能激励我创作更多更好的内容.
近期热贴 Recent Popular Posts
- The Chess AI - Model Base or Machine Learning 浅谈棋类博弃的两种实现方式:模式化和机器学习
- Software Engineer Interview Tips - Using Hashtable to Reduce Runtime Complexity 软件工程师面试技巧之 使用哈希表降复杂度
- 记录那些值得回忆的精彩瞬间
- I wrote a Chinese Chess Program 软件分享: 智慧中国象棋 (Chinese Chess)
- One Day Visit to Fen Drayton Lake (Photography) - 村庄附近的 Fen Drayton 湖
- One Night in Luton. 回到Luton十一年前打工的酒巴Brookes喝酒
- One Day Travel (Photography) Fen Drayton Lake + St Ives 英国 Fen Drayton Lake 坐公交到 St Ives 游玩
- What is Data Overfitting in Machine Learning? 机器学习中的过拟现象
也是听说过好多次但一直没有尝试,回头玩一下
R 语言适合数据分析(研究) ,不太适合 production (相比 Python 来说)
从这点来说, 有点像 matlab
Thanks for share.
resteeeeeem if you like it.. thanks
i installed this until R studio and started playing but stop.
Time to relook again. Too many things to learn.
Yes, keep learning...but R is more used in academic world!