Bitcoin: Will Stunning Rally Sustain or Sour in 2018?
Our previous article on bitcoin focused on the crypto asset as a currency and delved into the inherent tension in its role as a medium of exchange and a store of value. This paper examines why bitcoin is so volatile; its supply and demand drivers, and how the cryptocurrency compares to commodities.
What is most striking about the economics of bitcoin is the certainty of its supply and the vagaries of demand. The rate at which bitcoin is mined has been highly predictable and unlike almost any other asset – currencies or commodities – its ultimate supply is a known quantity, fixed well in advance. There will never be more than 21 million bitcoins. This feature makes supply almost perfectly inelastic. No matter how high prices go, miners will not produce more than 21 million coins. Moreover, price increases won’t necessarily incentivize a more rapid mining of bitcoin. Even if they did, it would only influence miners to create more bitcoin today at the expense of creating less in the future since the total supply will reach a hard, asymptotic limit of 21 million coins.
The supply inelasticity explains in large part why bitcoin is so volatile. Items with inelastic supply show a greater response to demand shifts than items with elastic supply. The same is true of demand: the more inelastic the demand, the greater the price change in response to small fluctuations in either supply or demand. In the abstract examples below, we show the relatively modest price response to an upward shift in demand for a market with normal supply elasticity, on the left, and contrast it with the much bigger price response from the same demand shift in an inelastic supply market, on the right (Figure 1).
Figure 1: Elastic Supply (Left) is Less Price Volatile Than an Inelastic Supply Market (Right).
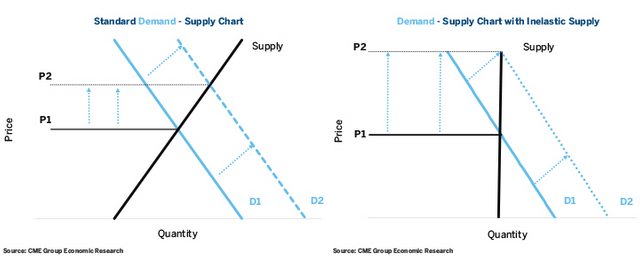
Figure 1: Elastic Supply (Left) is Less Price Volatile Than an Inelastic Supply Market (Right).
Of the various products that trade at CME Group, the most volatile is natural gas. It is a classic example of a market with highly inelastic supply and demand. If prices soar today, consumers will still need natural gas to generate electricity, heating and to fuel industrial operations and so they will be willing to pay up for it, at least in the short term. Natural gas demand is therefore highly inelastic.
The same is true of natural gas supply. If prices double, which for natural gas isn’t all that exceptional, in the short term, producers will likely not be able to ramp up supply. Similar parallels hold true for crude oil. What differentiates commodities like natural gas and crude oil from bitcoin is that their long-term supply shows some degree of elasticity. If natural gas or crude oil prices experience a sustained rise, producers can and will find ways of producing more – or at least they have, historically. This is not exactly the case for bitcoin, although rising prices might increase the probability of “forks” that split bitcoin into the original and a spinout currency such as bitcoin cash.
Bitcoin’s limited and highly inelastic supply is also a major factor driving its price, a rise so spectacular that it can only be appreciated when seen on a log scale. In bitcoin’s first four years, supply grew at roughly 2.5 million coins per year. Even so, prices were rising as the user community grew. Since then, supply has continued to grow but the pace of supply growth has slowed substantially while demand has occasionally dipped, even on a year-on-year basis.
Figure 2: Inelastic Expansion and the Slowing Growth of Bitcoin Supply.
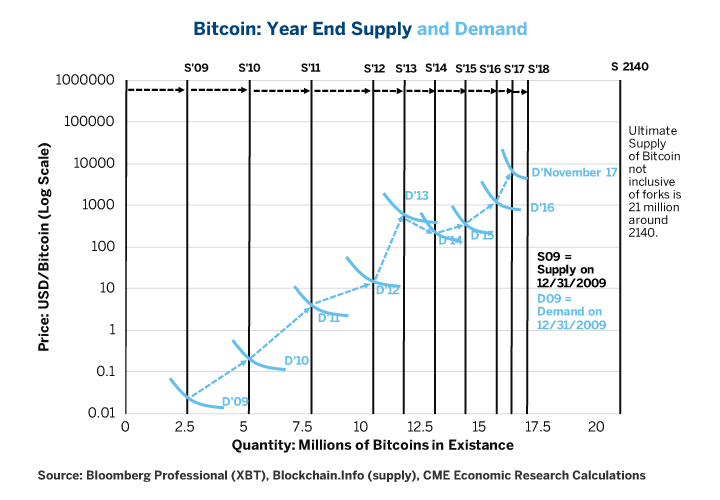
Figure 2: Inelastic Expansion and the Slowing Growth of Bitcoin Supply.
Bitcoin is “mined” by computers solving cryptographic math problems. In exchange for solving the problems, miners receive bitcoin. Those math problems have grown in difficulty over time, increasing the required computational power required to solve them. This in turn drives up the cost of equipment, and especially the cost of electricity to produce bitcoins.
This makes bitcoin a bit like energy products and metals. For example, as of late 2017, the producers of crude oil in the U.S. are probably profitable at around $40 per barrel. Above that price, they will obviously continue to produce, but below that level, they will begin to curtail production. Also like bitcoin, the difficulty of extracting energy sources from the earth has increased substantially over time. For instance, humanity went through the easiest-to-recover oil supplies near the surface many decades ago. Now, marginal supply increases come mostly from fracking deep under the ground, from offshore drilling or from oil in remote, difficult to access locations. In the second half of the 19th century, when oil was first produced in large quantities, one unit of energy invested in crude oil extraction produced around 150 units of energy. By the 1970s, that was down to around 30 units of energy for each one invested, and that ratio fell to around 15 by 2000 and is probably below 10 today. This has been a factor in driving oil prices higher.
For metals like copper, gold and silver, there are two numbers to watch: the cash cost and the all-in sustaining costs. Cash costs give a sense of at what price levels producers will maintain current production. All-in sustaining costs give a sense of what current and anticipated future price levels need to be to incentivize additional investment in future production. For example, the cash cost for gold mine operators averages around $700 per ounce while the all-in sustaining costs are around $1,250 per ounce (Figure 3).
Figure 3: The Cost of Mining Gold.
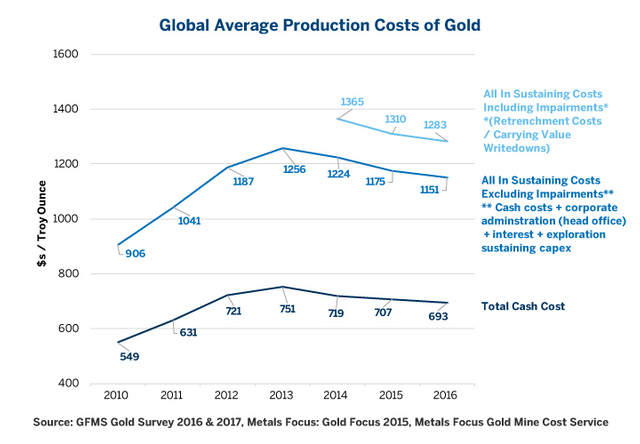
Figure 3: The Cost of Mining Gold.
What is interesting for gold, silver and copper is that after their prices fell in 2011, it squeezed the profit margins of operators, who in turn found ways to streamline their businesses and cut their cost of production. The same is true of the 2014-16 collapse in energy prices which may have lowered the marginal cost of production from $50 to $40 per barrel of crude. Like mining metals and extracting fossil fuels, mining bitcoin is also a competitive business. Not surprisingly, we see a similar feedback loop between supply ‘difficulty’ and price (Figure 4).
Figure 4: Bitcoin Mining Computations and Price
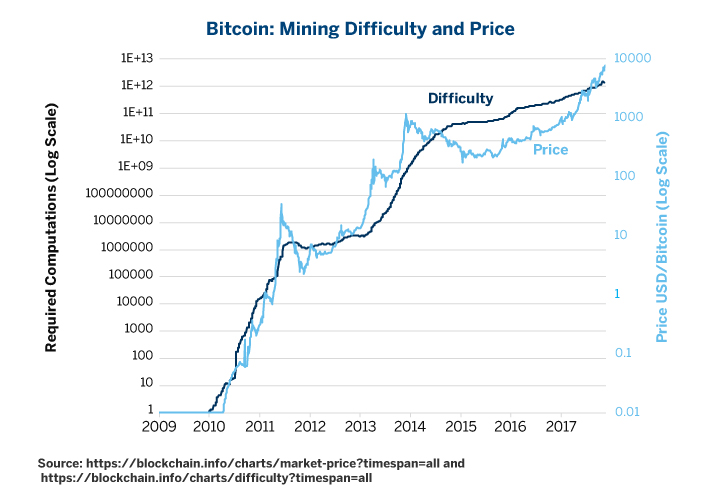
Figure 4: Bitcoin Mining Computations and Price
Glancing at Figure 4, it’s obvious that as the required number of computations (“difficulty”) rises, it makes producing bitcoin more expensive. This, in turn, drives up the price. True enough but this is not the complete story. There is another side to this feedback loop. Notice what happened to “difficulty’ after the first bitcoin bear market (a 93% drop in prices) in 2010-11. Its inexorable rise came to a two- year long halt until prices recovered. It was only when the next bull market began in 2013 that “difficulty” began increasing again. A similar phenomenon occurred in the aftermath of the 2013-15 bitcoin bear market (an 84% decline in prices). There, too, “difficulty” stagnated until prices began their next bull market. Given the level of prices in late 2017, it’s a good bet that “difficulty” will continue to rise but when bitcoin prices suffer their next correction, “difficulty” might stagnate again.
Thus, bitcoin supply appears to have at least one similarity to that of oil and metals. When prices fall, producers must take measures that cause production costs to stagnate or even fall. While “difficulty” never appears to decline, the cost of computing power has fallen over time, by as much as 25% per year. As such, if “difficulty” goes sideways for a year, the actual electricity cost of production probably falls as the amount of energy needed to perform the same number of calculations declines. Just as metals and energy producers find ways to reduce cost after bear markets, the bitcoin mining community appears to do the same.
One last comment on supply before we move on to demand: it has long been rumored that the founding community of bitcoin controls something in the order of 3-5 million coins. If this is true, in theory, higher prices could (and probably will) encourage them to part with their coins and exchange them into fiat currencies or other assets. When one takes this into account, bitcoin supply might not be perfectly inelastic in the very short term. A similar phenomenon exists in precious metals. When prices rise, we see an increase in the recycling of gold and silver (secondary supply). What is interesting, however, is that recycling appears to respond to prices, not drive prices. For gold and silver, the only supply that appears to drive price is mining supply. Likewise, if an existing holder of bitcoin liquidates some or all of her holdings, this increases its short-term availability but does nothing to influence its ultimate long-run supply.
Demand Drivers
While bitcoin supply is extremely transparent, bitcoin demand is rather opaque. That said, there are a few quantifiable items that we do know about bitcoin demand. First, we have a pretty good idea of the number of bitcoin transactions each day. Secondly, and more importantly, it appears fluctuations in bitcoin transaction costs play a major role in determining price corrections.
The number of daily transactions grew pretty consistently with the price of bitcoin in the early years but does not appear to be a major driver of bitcoin prices currently. That said, it is worth noting that the number of transactions stopped growing in 2012, about one year before bitcoin’s 2013 peak-and-bear market. It began to rise again in 2014 before bitcoin prices began to recover in earnest but has been stagnating recently (Figure 5). Does this portend another correction is on the way? We don’t know but transaction costs are showing even more ominous signs.
Transaction costs spiked from $2 to around $30 per transaction in late 2010 just before bitcoin prices suffered a 93% collapse. As bitcoin transaction costs subsequently fell, another bull market developed. Transaction costs edged higher in 2012 and then soared to over $80 by early 2013, which coincided with another collapse in bitcoin prices. By 2015, transaction costs eased toward $8 when another bull market began. Starting in late 2016, they began to rise again and are now nearing $60-$70 per transaction (Figure 6). Will this limit demand growth and provoke another bitcoin crash? If so, to what level will transaction cost have to rise in order to provoke such a correction?
While we don’t know the answers to these questions, we can make the following observations:
In 2010, bitcoin prices were around $30 and the cost of transaction rose to $30.
In 2013, bitcoin prices rose to around $1,000 and transaction costs got to $80.
With the price of bitcoin now around $10,000 as of this writing, could the market sustain transaction costs of $80, $100 or more without demand and prices collapsing? The answer to this question is not known at the moment, but we will likely find out at some point in 2018 or 2019.
Figure 5: Do Bitcoin Volumes Drive Price?
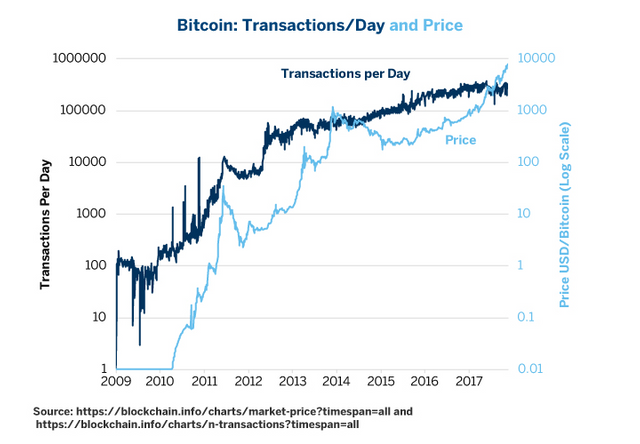
Figure 5: Do Bitcoin Volumes Drive Price?
Figure 6: What Level of Bitcoin Transaction Costs Can the Market Sustain?
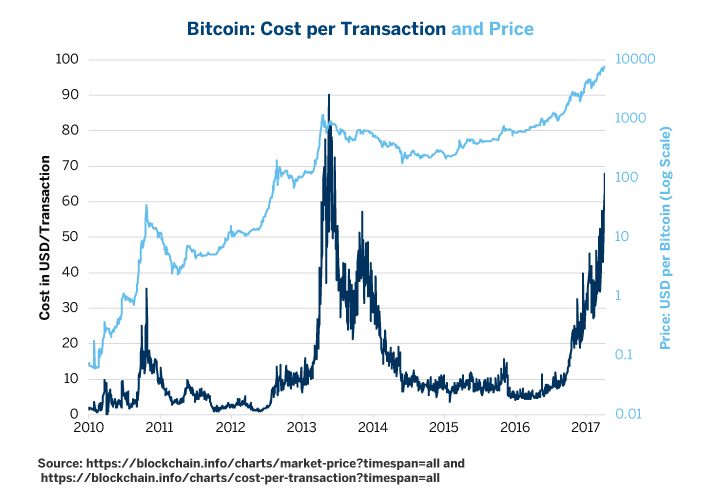
Figure 6: What Level of Bitcoin Transaction Costs Can the Market Sustain?
Bottom line:
Bitcoin supply is highly inelastic.
Inelastic supply increases volatility.
Mining “difficulty” and price are in a feedback loop.
Mining “difficulty” is a major driver of price.
Price also influences mining “difficulty.”
Transaction volume may influence price trends.
Rising transaction costs could cause a crash.
All examples in this report are hypothetical interpretations of situations and are used for explanation purposes only. The views in this report reflect solely those of the author(s) and not necessarily those of CME Group or its affiliated institutions. This report and the information herein should not be considered investment advice or the results of actual market experience.