$CLAM/BTC Technical Analysis Dec. 25, 2016.
Hello Steemers!

Merry Christmas everyone!
As I got bored today I decided to do a chart on CLAM.
Clams are ranked 59 on coinmarketcap and has had a pretty active trading history.
Fore more info about Clams check out their website and their Bitcointalk thread:
Website - http://clamcoin.org/
BCT thread forum - https://bitcointalk.org/index.php?topic=623147.0
As usual, clean charts for the start, will show the monthly weekly and daily.
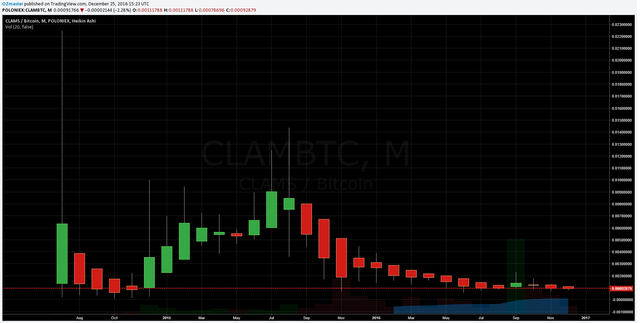
monthly chart Poloniex -clean - Dec. 25, 2016
We can see how CLAM had a initial downtrend from its all time high of 0.0225 BTC in July, till November 2014, where it also made it's all time low of 9000 satoshi.
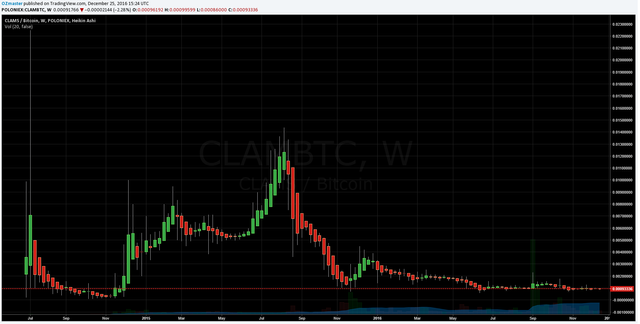
weekly chart Poloniex -clean - Dec. 25, 2016
Shortly after it started climbing hard in price and reached a new local high of 0.0144 BTC in October 2015.
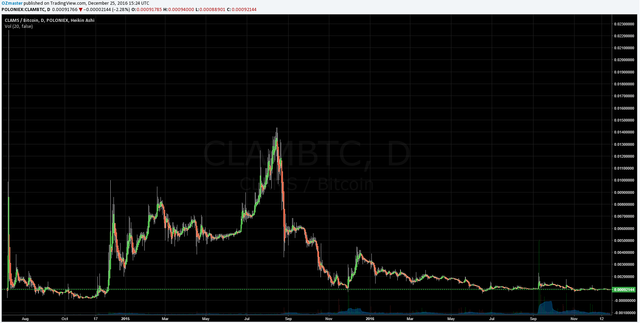
daily chart Poloniex -clean - Dec. 25, 2016
After the newly made local high, the price turned downwards sharply and started a long downtrend hitting a local low of 58k satoshi in June this year.
After the new local low the price stayed above it and traded with some spikes, but volatility has been dropping since.
Putting up some lines on the weekly and the daily charts.
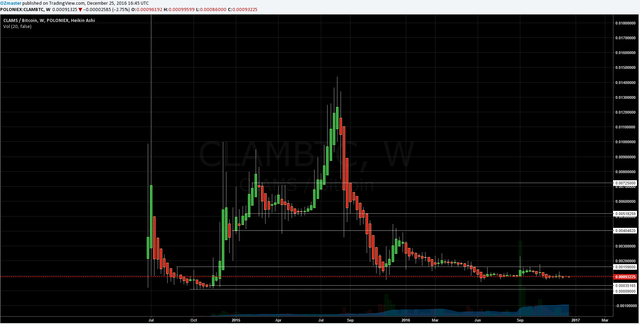
weekly chart Poloniex -lines - Dec. 25, 2016
After putting some lines on the weekly I spot some accumulation zones, 1st one looking like its ranging up to about 160k satoshi, above it one topping at 400k satoshi.
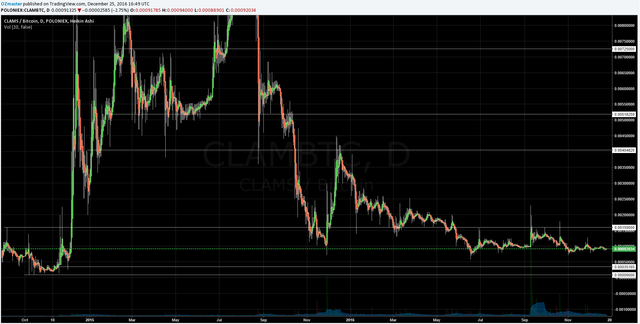
daily chart Poloniex -lines - Dec. 25, 2016
At the moment the price seems to be strongly retained bellow the 160k satoshi line flattening around the 90k satoshi levels.
For the end I pulled a fib on the weekly.
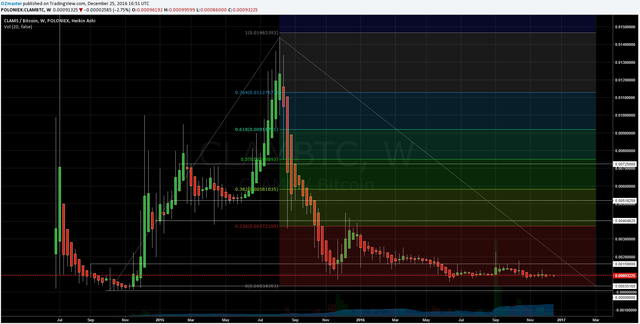
weekly chart Poloniex -fib - Dec. 25, 2016
With the fib on we can see the major accumulation area in which's lower end the price is trading now, topping near the 400k satoshi line.
Above it, the yellow fib area combined with the ~520k satoshi line shows some good support/resistance zone between the top of the fib area (580k satoshi) and the line of ~520k satoshi.
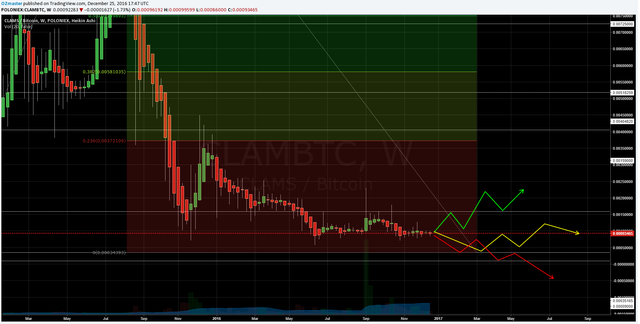
What to expect next?
1st (green) - The price respects the local low of 58k satoshi and starts and uptrend, breaking through the ~160k satoshi line and makes it a new support and starts trading in the upper half of the major accumulation zone.
2nd (yellow) - The price goes to make a new local low at around 35k satoshi from where it slowly starts turning into a uptrend progressing through the lower half of the major accumulation zone
3rd (red) - The price makes a new local low at around 35k satoshi, then tries to reverse the trend but fails and drops into new all time lows.
COMMENT
Once again, I will post the comment by commenting as it involves my personal opinion!
Thank you for understanding!
If anyone has any questions or need's help fell free to ask, I will try to explain as fast and as best as I can.
Critics, comments, reply's, counters, advice's, etc. are always welcome!
Have my charts helped you in any way?Let me know with a comment below :)
Are there more people who are doing TA?
Please post the links to your TA's posts into the comments as well!
DISCLAIMER
I am showing multiple scenarios on the price movement, in the post itself I do not take any stance, either bullish or bearish. I am not responsible for neither you’re winning nor you're losses upon trading! the "comment" section is my personal opinion and does not mean I have to or do hold any positions in the given market.
Everyone who uses TA develops his own unique charting style, please keep that in mind.
Merry Christmas everyone!
Kind Regards, OZ :)
Thanks for keeping us up to date with this technical analysis, Oz!
Upvoted and followed.
COMMENT
Thinking the price will wanna go make a new local low at around 25k satoshi and start turning from there on.
@ozchartart, always think of fast times at Ridgemont High when i hear this classic.
old but gold ;)