Flat Earth If It Doesn’t Fit It Must Be ShIt
Flat Earth If It Doesn’t Fit It Must Be ShIt
INTRODUCTION
This presents more data and its processing and analysis just like the previous blog post. All the explanatory details do not need to be repeated here. If you need to, refer back to the previous post. As before, all files are shared freely on my Scribd account, so people can see and check and analyze my work, and use these files to do their own experiments for themselves no matter where they are in the world.
For review I just want to summarize the basic concept upon which these types of experiments are based.
You travel a route and track it with GPS and independent odometer and speedometer, and maintain constant speeds as much as you can throughout the trip and note this information also. Afterwards you process the latitude longitude data versus time according to spherical earth surface geometry and flat circular disk earth geometry and compare the results. Invariably what you will find is that the spherical geometry interpretation reconciles all the data with itself. The flat geometry interpretation leads to significant contradictions.
It is really up to flat earth advocates to explain how the data should be interpreted in order to make it conform in all ways to flat earth geometry and theory and at the same time to reality. I claim that to make this fit flat earth theory is an impossibility. The pizza pie is really in their pizza oven now.
Now the way that I am interpreting the data according to flat circular disk earth geometry is to take the latitude longitude data and interpret it with the azimuthal equidistant map as if it were a flat earth map. Now I have tried interpreting it in two other possible ways consistent with different aspects of flat earth theory. Both of these ways also lead to significant contradictions.
One way is shifting all of the latitude data points up by the same amount to bring the west east gradient in terms of miles traveled per degree of longitude the same on flat circular disk earth geometry as it is on the spherical earth where the data was actually taken. This ends up fitting the speedometer and odometer data pretty well, but obviously the location is way off, as it shifts my San Jose data north around 500 miles to approximately Sisters Oregon.
Could flat earth advocates actually have an uncertainty of locating a place on the flat earth map of as much as 500 miles? If their “map” which they claim not to really have yet, has this much uncertainty, then what business do they have using any so called “flat earth map” to justify all of their many claims that the earth is flat, like the way that the Sun and Moon circle around it, and the way that airline flights make more sense (they claim) on the flat earth map than on the spherical earth map?
And then the other way I have tried to make the data fit flat earth circular disk geometry is to essentially flatten the spherical data and then plop it somewhere on the flat earth map. The spherical data itself is close to being flat just by its nature of being a route of not much overall distance on the earth, but mathematically it is kind of like me taking that route that is already pretty close to flat and putting it on an ironing board and ironing it flat so I can then easily plop it onto any flat earth map. Here again, we would need the flat earth advocates to tell us where to plop it. So I choose making the starting point of latitude and longitude the same on the flat as on the spherical. When I do this, there is quite a bit of agreement, but the route ends up not coinciding with the actual route of the trip. Again, it just does not fit. At this point I am holding off on presenting this additional information in detail, until I can find a way to present it in as simple and understandable way as possible. Also, I want to give flat earth advocates a chance to struggle with trying to make their flat earth model fit the real world data.
How long can flat earth advocates keep hiding underneath their undefined flat earth map?
Eventually many will have no choice but to exclaim, “Look! The Flat Earth Emperor is wearing no map!”
SO NOW ON TO PRESENTING THE NEW DATA
Here I want to illustrate how a shorter trip can provide good data for this type of experiment and analysis. After this perhaps I will try an even shorter trip by car around just residential streets. If that ends up working OK, then the next step might be to see if the experiment can be done by walking a route around the neighborhood.
The same file naming scheme as before is still used. The previous blog explained the rationale behind this. In this case in the Excel files the data extends down to row 1642.
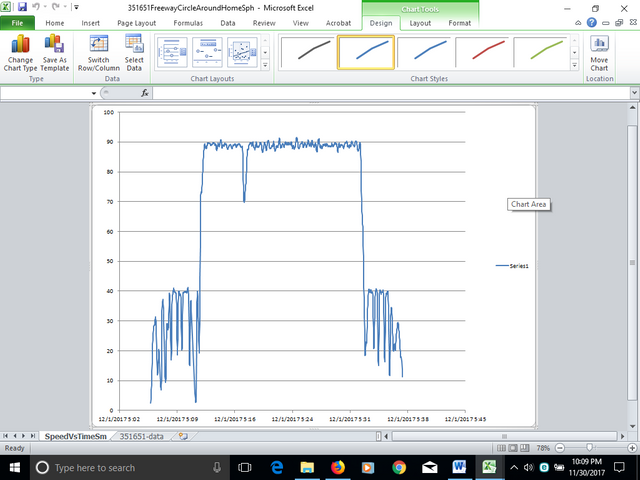
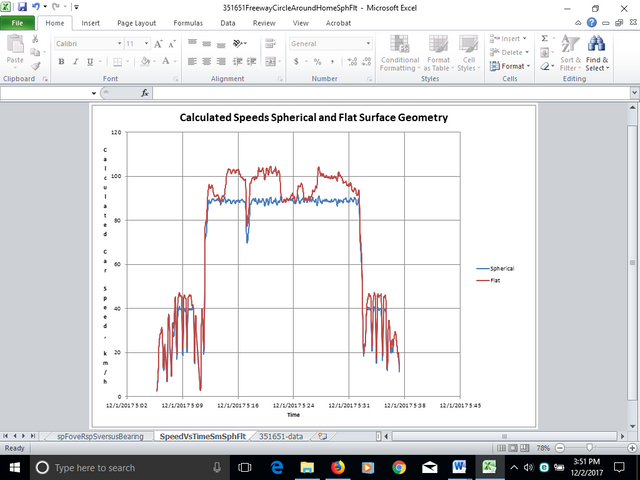
For this trip I was able to hold a constant speed with cruise control for almost the entire distance on the freeway. There was really just one place where I had to slow down briefly for some night time construction work. As before, the constant speed held shows up very clearly in the data processed according to spherical earth geometry, whereas when the data is processed according to flat earth geometry the long intervals of constant speed deviate markedly from being constant. Here’s the results.
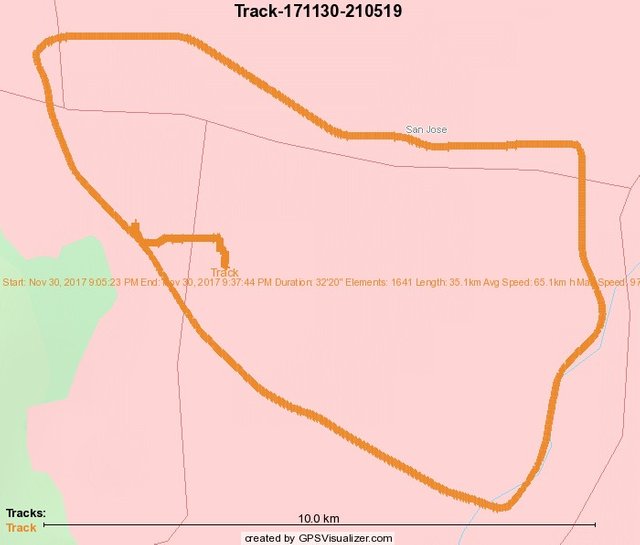
Freeway Circle Around Home in San Jose
35.2 km (21.9 miles) by odometer
Duration by watch 0:32
Duration Start to Stop GPS 0:32:20
35.1 km 65.1 km/h ave speed 97.2 km/h top speed by GPS
35.054 km 65.015 km/h ave speed confirmed by calculations in Sph Excel spreadsheet
Speed versus Time plot for spherical model shows clear agreement with speedometer data
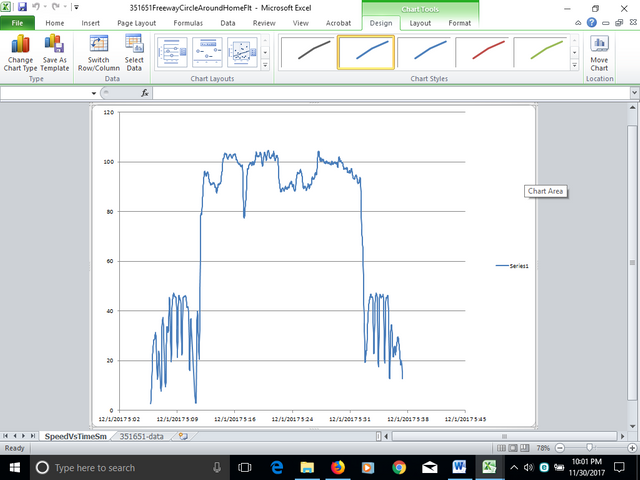
Speed versus Time plot for flat model shows large deviations from speedometer data
38.2 km 70.9 km/h ave speed by calculations in Flt Excel spreadsheet Inconsistent with odometer data
Spherical Earth model: Affirmed
Flat Earth model: Large deviations from reality
Speed versus Time according to Flat theory
Speed versus Time according to Spherical theory
Speed versus Time according to Spherical and Flat theory all on the same graph.
I have made these files available to the public through my Scribd account.
20171130214830-38065-data Text file
https://www.scribd.com/document/366015520/20171130214830-38065-data
351651FreewayCircleAroundHome Excel file
https://www.scribd.com/document/366015680/351651-Freeway-Circle-Around-Home
351651FreewayCircleAroundHomeFlt Excel file
https://www.scribd.com/document/366015813/351651-Freeway-Circle-Around-Home-Flt
351651FreewayCircleAroundHomeSph Excel file
https://www.scribd.com/document/366015946/351651-Freeway-Circle-Around-Home-Sph
Anybody should be able to see the files by just going to the links. The graphs of Speed versus Time for both the spherical and flat cases should be able to be seen this way in addition to the links earlier in this post. To download the files you need a Scribd account, and a regular account should be free to set up.
I was not able to make the KML file Track-171130-210519 available through Scribd because it is not a supported file type.
I encourage people all over the world to take their own data and process it in this manner and report their results. Let me know if you have any questions. Comments are welcome. Thank you.