Shattered Trends
Everyone is wondering what the markets will do in 2019. After a rocky 2018, this is a reasonable thought process.
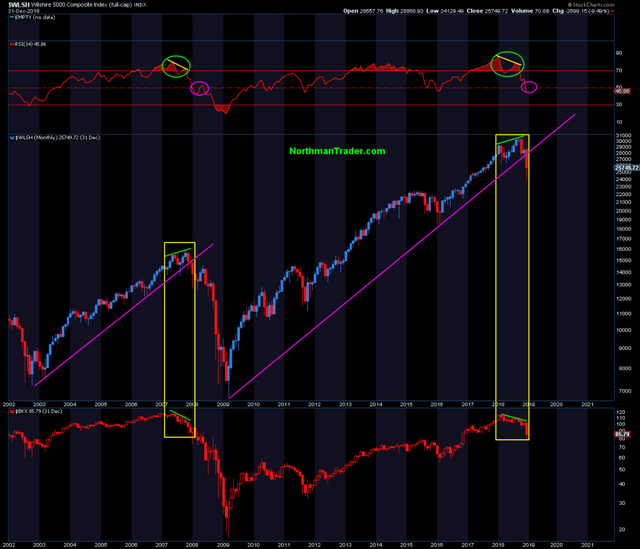
The challenge for the bulls is that the charts are not very favorable. Technicians have to be leaning towards the bear. We see a number of charts showing how major trendlines were broken.
Trendlines are a basic tool used in charting. The downside breaking of a long term trendline can often signal "look out below". This tends to get fiercer with so much of trading being done by computers.
According to these charts, 2019 is going to be a nasty year in the markets.
Click on image to read full story.
