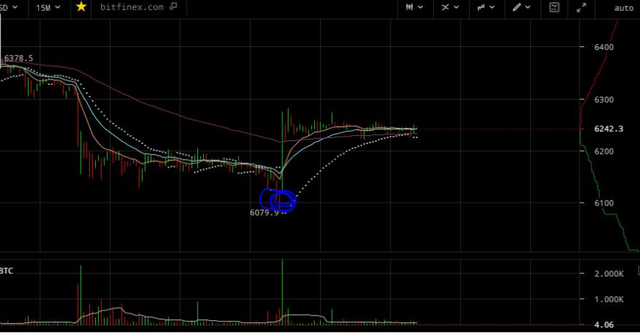
(질문)마진 거래 시 저점찾기violencerider (29)in #chart • 6 years ago 크립토와치 차트입니다. 마진거래의 경우 고점이든 저점이든 차트 분석이 필수로 요구되는데, 아직 정확히 잘 안보이네요. 첨부된 그림에서 누군가는 저점을 미리 파악했다고 하는데요. 횡보후 급락은 패닉장인데, 여기서 저점을 인식할 수 있는 지표는 과연 뭘까요? EMA, SAR, 거래량을 종합적으로 봐야할 것 같은데, 누군가 사후 설명 좀 부탁드립니다.! #analysis #bitcoin #margin #long
Congratulations @violencerider! You have completed the following achievement on Steemit and have been rewarded with new badge(s) :
Click on the badge to view your Board of Honor.
If you no longer want to receive notifications, reply to this comment with the word
STOPTo support your work, I also upvoted your post!
Congratulations @violencerider! You received a personal award!
You can view your badges on your Steem Board and compare to others on the Steem Ranking
Vote for @Steemitboard as a witness to get one more award and increased upvotes!