EOS/BTC June 20 2019 Bad Day
Update from my previous EOS/BTC chart on June 13 2019
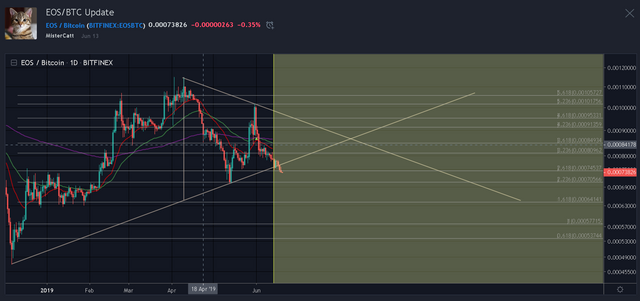
looks like it managed to close below the short term up trend line.
here's for the update chart for a short term chart
.png)
Keypoint :
Short term bounce is expected from the way of indicators look. stochastic is bottom out. Slight bullish divergence between histogram seller and price action as it's made a lower low but a higher low in buyer histogram MACD.
while overall trend is still bearish from DMI indicatorYellow fibonacci line (fibonacci sequence x 1.618) is expected to be a important support and resistance. the closer recent fibonacci line with the golden ratio fibonacci is expected a heavy resistance and support. break one of those would cause a major movement.
Thank you for your time to read this post and please take this idea as a grain of salt as reality always differ from what i expect as this post merely just an opinion.
and please feel free to share what your thought on comment section.
peace.