BTC/USD Update June 20 2019
Updated from June 16 2019 chart
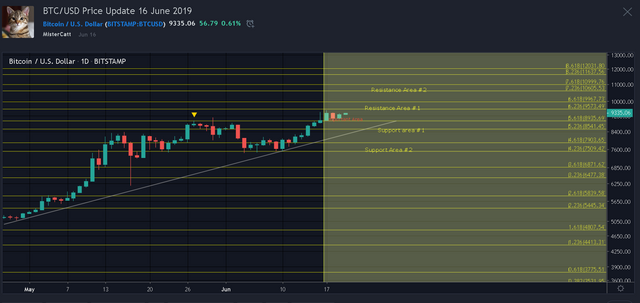
It's seems btc/usd still above the important area that is mentioned. which is bullish trend is still persisted currently.
.png)
- Yellow fibonacci line (fibonacci sequence x 1.618) is expected to be a important support and resistance. the closer recent fibonacci line with the golden ratio fibonacci is expected a heavy resistance and support. break one of those would cause a major movement. see the image to get a closer look the position of potential heavy support and resistance. it's applies for Recent Up trendline (white line) is also a pointer for me if the bullish trend could be maintained for short term.
.png)
Indicators :
Macd : macd line is interestingly will crossed again which is a bullish sign. Seller histogram also beginning switch into buyer histogram.
Stochastic RSI : looks like it will try to move toward the upper line as it's already enter above 50 /bullish area.
DMI : +DI is somehow pointing upward again, avoiding to cross with -DI . although it's diverging/not correlated between the price action and +DI. ADX is above 25 and currently pointing down, still have a juice left for btc/usd to move up atleast to get above the current fibonacci level that being test now.
Thank you for your time to read this post and please take this idea as a grain of salt as reality always differ from what i expect as this post merely just an opinion.
and please feel free to share what your thought on comment section.
peace.