BTC/USD Retracement In Progress
Update from my previous chart regarding btc/usd upcoming retracement.
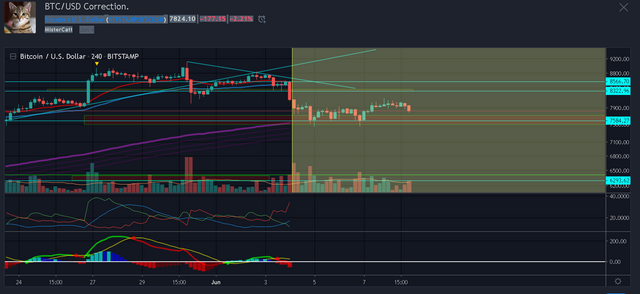
On 4 hour timeframe, BTC/USD already below 2 down trend line and 21 + 55 EMA at the moment and with high probability to to test 200 EMA again interestingly btc/usd manage to made a higher low and higher high atleast in very short term. -click the picture to show it's potential support-
.png)
Indicators:
DMI : DMI is beginning to weaken as it's start to rise up above DMX and increase it's range between DMI- and DMI+. bearish trend is dominating as for now.
MACD : MACD is ready to switch to seller histogram, interestingly the buy histogram do made a higher high from the previous buy histogram. for macd EMA is currently trying to get above 0 value/bullish zone.
Volume MA slight increase by seller volume
this chart invalidated once price action goes above 55 EMA with many consecutive candle closes
.png)
please take this idea as a grain of salt as reality always differ from what i expect as this post merely just an opinion.
and please feel free to share what your thought on comment section.
peace.