Will we see Chain Link to search for the new highs?
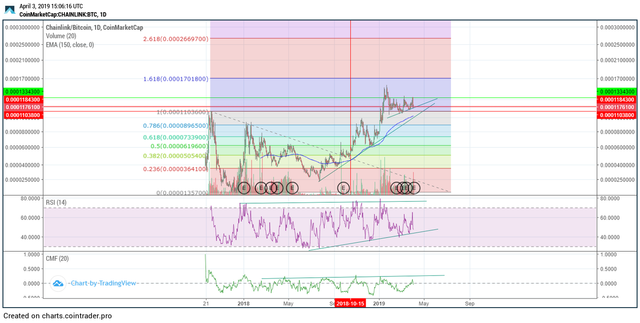
This is a daily chart of chain link, which has broke out to search for the new highs. For this analysis I have decided to use Fibonacci's retracement to show you how well it worked with this graph. The first real resistance appeared, as it usually is, at the level of 0.38. Normally, the price tends to slow down around the 0.61 levels. Despite that, it moved right to the 0.78, retraced, and continued to break out of the long term patter. Generally the first rallies reach the levels of 1.6. Since it already peaked once, the second wave could go as high as 2.6 Fibonacci extension. Also note the red horizontal line, which tracks when Chain Link came to the spot light of Daneel. You can notice that it's right before the first big pump up. If you would like to see the article itself, simply ask Daneel for news on LINK and you will be able to see it right at the bottom. It is also possible that we might see a fall down. In that case, relate to the trend RSI and price trend line in the picture to decide whether to hold or to sell. In this set up it's important to be careful in case this is the beginning of the bearis trend, and that we are actually breaking out.
For those of you who wonder what Fibonacci retracement and extension are, relate to this article: https://www.tradeciety.com/how-to-use-fibonaccis-in-your-trading-effectively/