What are Candlestick Charts? Their Body, Shadows, Trends and Signals?

While most people have an understanding of the crypto market, but many might not understand what candlestick charts, bodies, shadows, trends, and signals are. This article explains all of the above in detail.
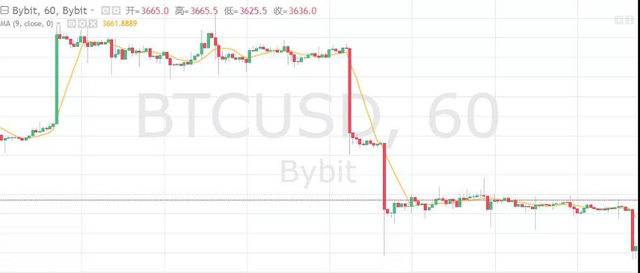
Candlestick Chart
The up-or-down fluctuations of a price are represented in the form of a candlestick chart. Traders can see market trends through these. Rising prices are marked in green, and falling ones are marked in red. Candlestick charts can be represented with different time frames such as daily candlesticks, hourly candlesticks, minute candlesticks, etc. The monthly candlestick chart represents the market trends over the course of a month, from the beginning of the month to the end. When switching to weekly candlesticks, every month can be divided into four weeks. To go further, a weekly candlestick chart is composed of 7 daily candlesticks (as the crypto markets are open 7 days a week), and so on. Each time frame may present drastically different movement as while the price during one day may have moved a lot, it may finish close to its open price and as such appear to have moved very little when looking at daily candlesticks.
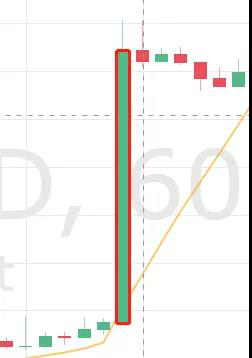
The body and shadows of candlestick charts
Candlesticks are made of two parts, the body and the shadow. The body marks the starting location and ending location of the price during the given time, while the shadow marks the highest and lowest level the price rose of fell too during the given time. For example, for a green hourly candle, the green aspect indicates that the price went up so the lowest part of the body is when the price was at at the start and the highest part of the body is were the price was at after an hour. The shadow indicates that the price did rise higher but fell back to where the body finishes at the end of said hour.

Candlestick Chart Trends
Trends are used to describe Candlestick Chart patterns, usually correlated to the fall or rise of the price, with the high and low points of several small trends being linked together to form a larger trend. Down below are the three most common trends observable in charts.
1. Upward Trends
Upward candlestick trends refer to when a chart has new low points being higher than previous low points, and new high points also higher than previous high points. They are generally self sustaining to a point as a they increase confidence in the market and thus the price and are represented by an arrow going up in charts.
2. Downward Trends
Downward Candlestick Trends refer to when a chart has new high points lower than previous high points, and new low points also lower than previous low points. They are generally self sustaining to a point as they decrease confidence in the market and thus the price and are represented by an arrow going down in charts.
3. Consolidation Trends
Candlestick consolidation trends are a different type of trend. In them, the price is not consistently going in one direction but instead switches between going high and going low, with the high and low points being relatively close to one another.
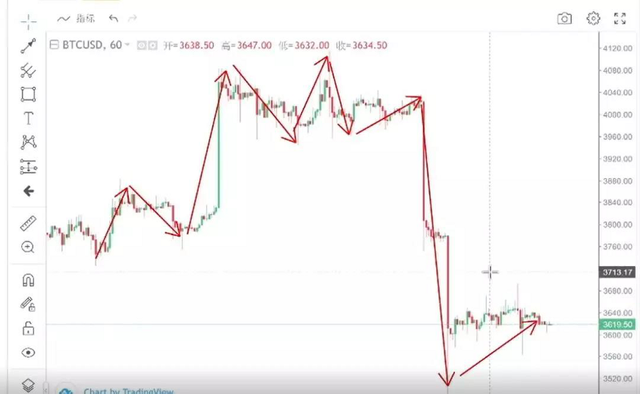
The above picture is a clear example of an upward trend to the left followed by a consolidation trend in the middle before finishing with a strong downward trend on the right.
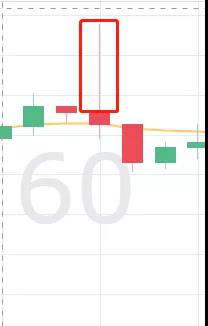
Candlestick Reverse Signals
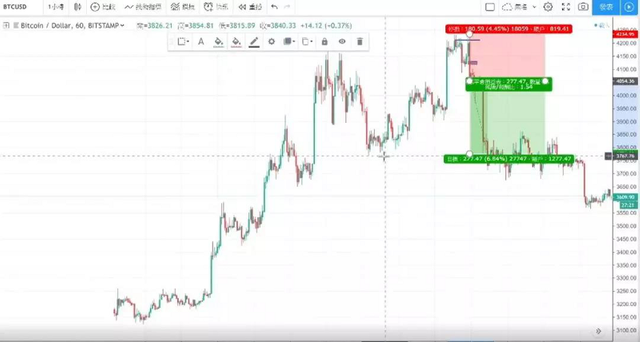
Indications that a market may reverse don’t always appear directly on the body of candlesticks but instead can be seen through the fact that shadows consistently appear in certain areas and consistently break through previous low, or high, points. Those are good indications of a market reversal coming up and that one should enter the market.
As the diagram below shows,the market has reversed at its highest point and it is recommended to enter it now at 4,054, place a Stop-Loss at 4,234 and a Take-Profit at 3,767.
This article was written and shared by Gabriel Yeh. The views and opinions expressed in this article are those of the author, do not necessarily reflect the official policy or position of Bybit, and comes from his many years trading in both traditional and cryptocurrency markets.
We hope you learned a lot in this article about what candlestick charts, bodies, shadows, trends, and signals are; enjoyed the read; and stay tuned for more great content.

Where to Find Us:
Website: https://www.bybit.com
Twitter: https://www.twitter.com/Bybit_Official
Reddit: https://www.reddit.com/r/Bybit/
Youtube: https://bit.ly/2Cmuibg
Medium: https://medium.com/bybit
Facebook: https://bit.ly/2S1cyrf
Linkedin: https://bit.ly/2CxHGcz
Instagram: https://www.instagram.com/bybit_official/
Telegram: https://t.me/BybitTradingChat