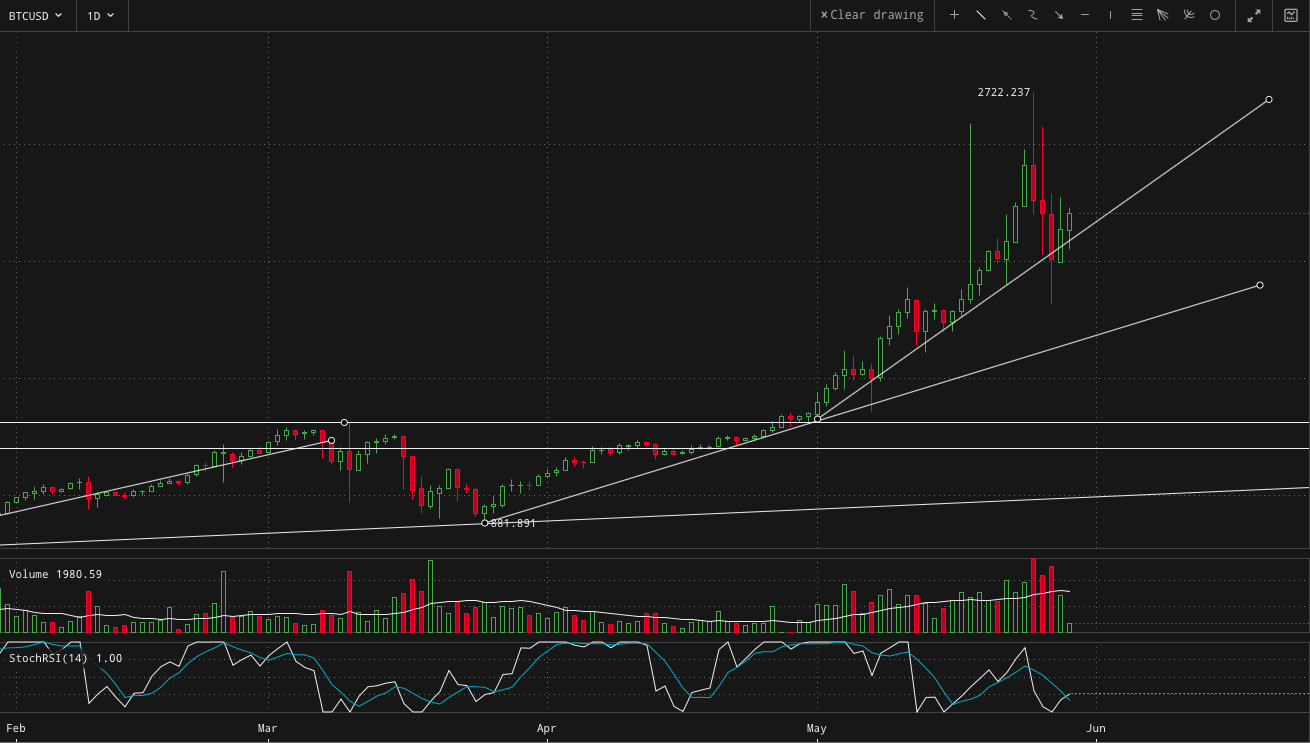
Bitcoin Technical Analysis - Looks Good -

Hello there!
Let's take a look at Bitcoin.
Here my daily analysis that I'm happy to share with you.
Bitcoin
I've drawn the last trend line seven days ago and so far it looks it may be a pretty solid new support line if projected into the future. In case it decides to drop further the next support line is around 1700, as you can see in the chart.

BTC US Dollar
Let me know your thoughts in the comments.
_
Bitcoin website
https://bitcoin.org
soon it is back up :)
I still have a short and hold call on bitcoin based on the chart analysis of U.S. exchange traded "bitcoin tracker" GBTC. My short entry there was 483.00 I think it was. You can check my posts if you'd like. I also noticed a daily trade opportunity in actual bitcoin. I have been trading that for 19 straight days now. It already banked its $50 gain per coin within 2 hours of today's buy. Banked gains now at $896/coin in the past 19 trading days. Check the both out. I'll post my longer term buy signal on Bitcoin ifn when GBTC tells me to. I plan of doing the daytrade until it bankrupts that banked balance. :-)