Trader Guidance | Basic Trend Analysis

Written by Gabriel Yeh, a talented enterprising trader and senior analyst who invented a compound interest multiplier asset management module at the age of 18 and made $ 100,000 using $ 2,500 within 3 weeks.
There exist three trends in the trading market:
Uptrends (up)
Downtrends (down)
Consolidation trends (neither up nor down)
Here are some tips with which to decide which trend the existing market belongs to.
1. Uptrends:
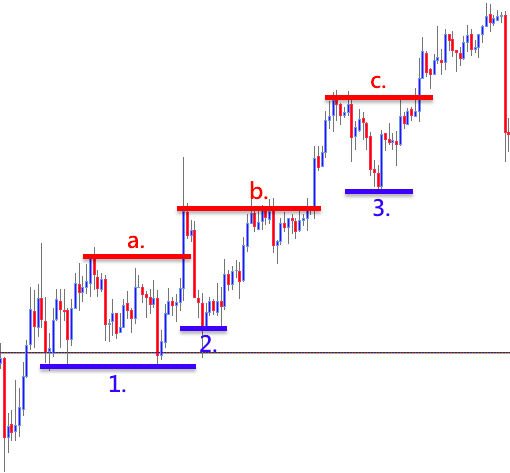
In the above figure six points are tagged as 1.2.3. and a.b.c.
Points 1.2.3. represent support results in the wake of low points, while points a.b.c. represent resistance results after the highs reversal.
An uptrend manifests itself when peaks and troughs move higher than previous ones, indicating that the uptrend will continue. For example, an uptrend will likely continue as long as a new trough is not lower than point 1. which after moving past point a. fell to point 2. The uptrend continuation hinges on the fact that the new trough moves higher than previous ones.
As shown in the figure above, the uptrend continues past point b.; the price is very likely to keep bullish if the trough at point 3. moves higher than point 2. after moving past point b. and falling below point c.
2. Downtrends:
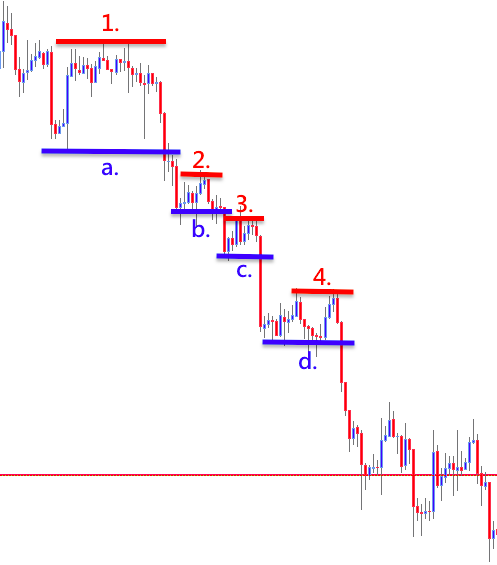
A Downtrend is made apparent when peaks move lower than previous ones, meaning the downtrend is likely to go on.
For example, the price leaves a peak at point 1 before falling below point a, and this downtrend is expected to continue as long as peaks following point 2. are lower than point 1. Whether the downtrend will last depends on whether new troughs are lower than previous ones.
As seen from the figure, the downtrend continues after new troughs are lower than the one at point b. Likewise, a rebound happens after a support low point at point c. is lower than the trough at point b. Then the resistance turning point at point 3. makes all the difference. It’s very likely that a bearish market will materialize if point 3. is lower than point 2.
3. Consolidation trends
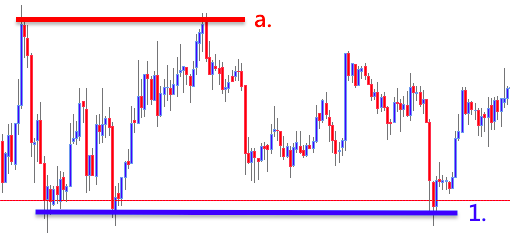
Aside from the uptrend and downtrend introduced above, there is another trend: lows or highs are followed by new ones in a horizontal level. A consolidation trend presents itself when there is no law in the change between lows and highs. That is to say, highs are in a horizontal level, as are lows, which characterizes a consolidation trend.
In the figure above, there are three obvious turning points at the level of point 1, which fail to make a higher highs or lower lows. As for the resistance level at point a., there are two obvious turning point at a horizontal level. It is advisable that a wait-and-see approach be taken ,with neither long position nor short position, until the market trend becomes clear after which a position may be taken.
This was a brief introduction to uptrends, downtrends, and consolidation trends. Please leave a message if you have any question or opinion. Thank you very much and see you next time.

Where to Find Us:
Website: www.bybit.com
Facebook: www.facebook.com/Bybitofficial
Twitter: www.twitter.com/Bybit_Official
Reddit: www.reddit.com/r/Bybit/
Medium: www.medium.com/bybit
Bybit is not responsible for material posted to this social media site and does not guarantee the content, accuracy, or use of the content in this site. Bybit specifically disclaims all liability for claims or damages that may result from any posting on this site. Bybit accepts no responsibility for the opinions and information posted on this forum, and such opinions do not necessarily reflect the policies of Bybit. In no event shall Bybit be liable to you or anyone else for any decision made or action taken by you in reliance on information on this site.