[WTC / BTC] Will the price continue to rise without stopping here? - Chart analysis for beginners (6/6/18)
and the bar closed up above 50ma.


Let's take a look at the year to date daily chart of the WTC.
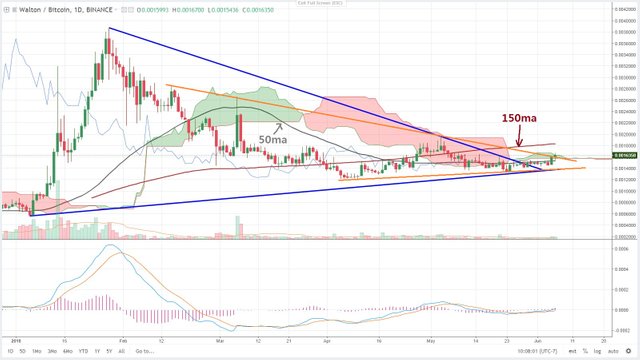
- You can see that the WTC went up through a large blue triangle and a slightly smaller orange triangle.
Now let's zoom in on the daily chart.
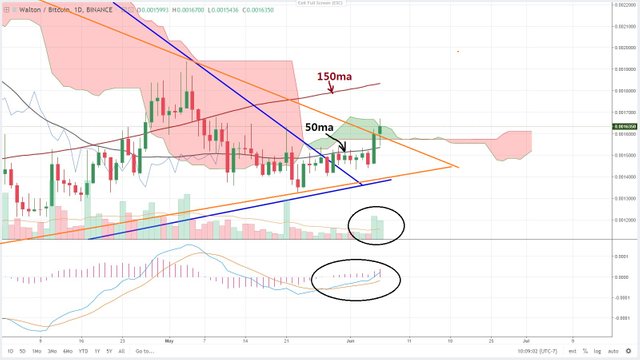
- The volume seems to be increasing.
- MACD also looks good because it looks like it crosses up the 0 line.
- Chances are high that it will re-tested the 50 moving average line again.
- From the current price of 0.0016400 to 0.0015000, which is slightly below the 50 moving average line, seems like a good spot to buy.
- If the price goes up through the ichimoku cloud, I think the probability of it going up is high.
Disclaimer : Do your Own Research. My content is intended to be used and must be used for informational purposes only. It is very important to do your own analysis before making any investment based on your own personal circumstances.
느낌이 좋은 그래프네요.. 총알이 없어서 들어가지 못해 아쉽네요.
감사! 성투!!
다른것들 갖고 계시니까 이거 없어도 되죠 뭐.
제이님
Dent 한번만 봐주세요 ㅜ
Dent 심볼이 뭐죠? 어느 거래소?
Dent 요
쿠코인 있어요 :)
감사합니다!!!!
장기 차트로 보니 코렉션이 상당히 기네요. ㅠㅠ
글쎄 말이에요... 상당히 깁니다...