The S&P 500 is Outside of 3 Standard Deviations on a 40+ Year Timeline 🤔🤔
Is 48 Years Long Enough for You on the S&P 500?
It is for me. We could do more and get a slightly different number, but take the calculation at any point starting around or before the 70's, and pull it towards the present... you will come up with more or less a range of mean lines that will tell you one thing, the current S&P 500 is outside of 3 Standard Deviations on almost any long term timeframe. And measuring the current move, it's outside of 2 Standard Deviations.
https://www.tradingview.com/x/o6NYMg5C/
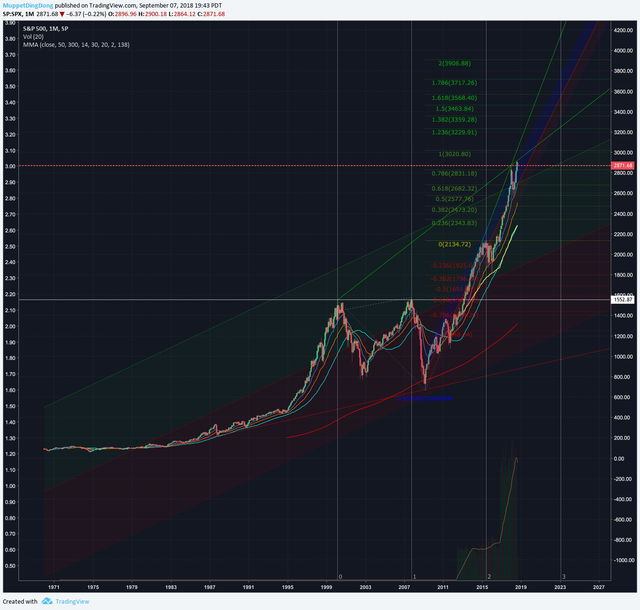
- The Red and Green areas are the 3 Standard Deviation calculation from Jan 1970-present and shows a reversion back to the mean (where red and green meet) would be extremely painful for the market.
- Calculate a different linear regression to any of the peaks, or lows from the dot com bubble or 2008 recession and today we only look more "outside the range"
- 1970's actually represent a great starting point because that's when Nixon changed americas high tax rates, wages started stagnating, boom bust cycles appeared again since the 30s, and the gold standard or gold backed dollar officially died. The credit economy began with the Fed and central banks controlling virtually everything about monetary policy. So the rate of change SINCE the 70s is a good (better?) gauge vs say using any pre-war numbers that would only further skew this slope DOWN.
A Closer Look at the Present:
https://www.tradingview.com/x/iRoaAQUc/
.png)
- The 2 standard deviation (Red and Blue areas) calculation of the current run has us on a steep slope that is historically just completely unsustainable.
- Dot com peak to current peak is causing the green line to act as resistance, and on the shorter time frame just looking at the current run.
- The S&P 500 price line is actually breaking out of BOTH Linear regression areas.
- This cycle happens to dwarf 2000, and 2008 by almost double. Parabolic run ups mean crashes ex. 2008 was almost 60% top to bottom
- Psychological 3000-3200ish is feeling really "toppy" ... could go a few more ticks on the Fib lines, but we are over-extended based on very long term averages across 40+ years
- The Fed is unlikely to be able to do shit to stop us from falling into a recession at the first real sign of problems, not just broad market consolidation, because rates have been low for almost a 2 decades relative to the rest of history and the broader economy is weak AF from a antifragility standpoint.
- Politics and another chaotic election are going to play their part to wildly move the ball, one way or another. Maybe corporate profits on low taxes carry us all? Haha I won't hold my breath.
A Quick Lesson on Standard Deviations
"In Statistics, the standard deviation... is a measure that is used to quantify the amount of variation or dispersion of a set of data values. A low standard deviation indicates that the data points tend to be close to the mean (also called the expected value) of the set, while a high standard deviation indicates that the data points are spread out over a wider range of values."
https://en.wikipedia.org/wiki/Standard_deviation
Okay So What?
2 and 3 standard deviation measurements are generally powerful and quick calculations (using charting software at least) that allow you to tell if something is for instance wildly outside of its average / expected value or if it's chugging along with all the same general pace over time.
- 2 standard deviations represents 95% of the sampled data.
- 3 standard deviations represents 99.7% of the sampled data.
This article https://www.investopedia.com/articles/trading/09/linear-regression-time-price.asp really breaks it down well and the general trading / set up stragegy behind linear regressions but the general idea, buy any time it breaks below the 2 or 3 standard deviations:
Sell anytime it breaks above the top of 2 or 3 standard deviations:
Hey that looks an awful lot like the S&P Chart hmmm 🤔🤔🤔
Essentially, the above article suggests the top of the linear regression area is your price target, having cleared that area and then some, we generally speaking have more room to go down than up.
Money for Nothing
A great documentary that should give you a concept of what the Fed is likely to do when we do face problems, and why they will likely act badly trying to stop it, probably won't actually stop anything, or will just make things worse somewhere later in time:
May the odds be ever in your favor
Just some guy ranting on the internet, not financial advice.
Thanks, I don't know much about standard deviations but found this really interesting, if a little unnerving.
Also, if you're interested in the workings of the Fed, check out Adam Tooze's new book 'Crashed'. There's a great podcast summary on the LSE website.
Standard Deviations and linear regressions aren't usually traded on alone in a vacuum, but they sure tend to put broad market action into some context.
I definitely am interested in learning anything I can about the Fed, I'll take a look.