SEC | S20W1 | Spreadsheet Essential For Beginners (Spreadsheet Overview, Spreadsheet Interface & Basic Formulas)
Hello everyone.
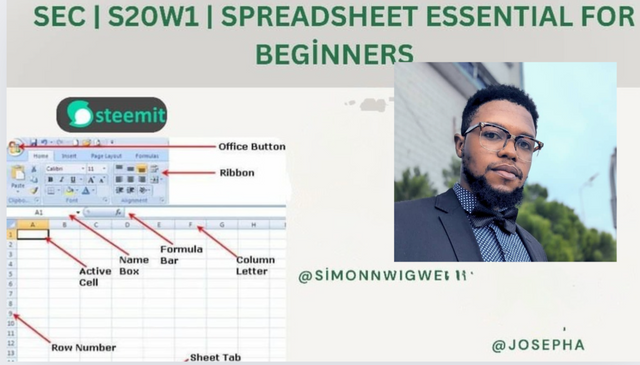
Greetings to you all and welcome back to the season 20 of the steeemit engagement challenge. I'm really excited to be participating on this amazing contest brought to use by @simonnwigwe and @josepha. This is a great opportunity for us to learn something new.
To begin with, I have always been willing and even go as far as getting someone to teach me the basics of excel. But so unfortunately I have not been lucky enough to get that chance. With this contest I think I will use the opportunity to the fullest to learn it as far as it goes.
| Explain my own words the understanding of the Spreadsheet, listing its features, its purposes, and an example image that follows your explanation. |
|---|
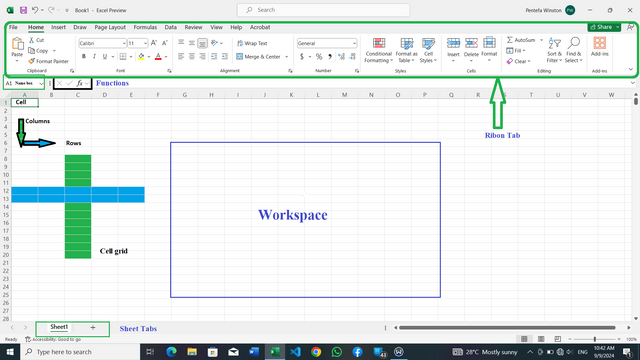
A spreadsheet is a digital work space used to organize, store, and manipulate data. It's consist of a grid of cells arranged in rows and columns, where each cell can hold text, numbers, formulas, or other types of data.
The spread sheet consist of Key Features Such as:
- Cells: These are the basic units of a spreadsheet, each capable of holding data in variety of forms such as
text, numbers, formulas.
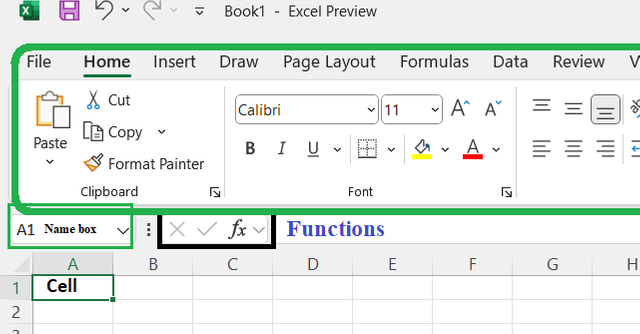
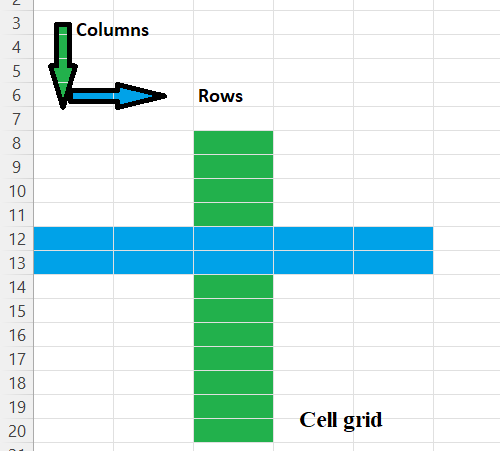
Rows and Columns: Crucial for Organizing cells horizontally and vertically. This constitute the entire workspace of a spreadsheet.
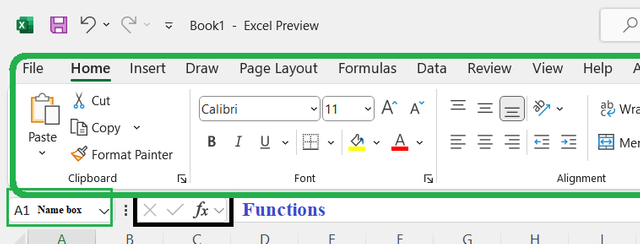
Formulas: Allow us to perform calculations on data within a given cells.
Functions: Built-in formulas that automate common calculations. Examples include
=sum(), =Average (), =if(), =count() =sumif()
Charts and Graphs: Helps us Visualize data in a variety of formats.
Formatting: this generalize the appearance of cells, including font, color, and alignment when customized.
Ribbon tabs: constitute a majority of tabs which are necessary for editing a spreadsheet.

Pivot Tables: Summarize and analyze large datasets.
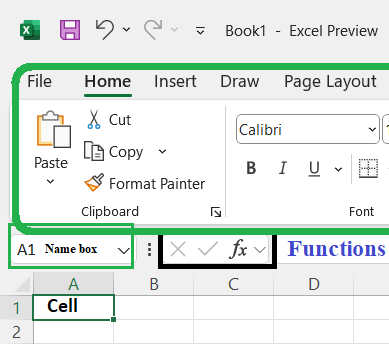
Purposes of SpreadsheetsName box. Indicate the name and number of the cell we are currently working on.
Spreadsheets are versatile tools used for a wide range of tasks, including:
Financial management Tracking budgets, expenses, and income.
Data analysis for Identifying trends, patterns, and correlations.
Project management use for Scheduling tasks, tracking progress, and managing resources.
Inventory management for Keeping track of stock levels and orders.
Database management in Storing and organizing information.
Use Education for creating worksheets, quizzes, and assignments for learners
Spreadsheets are essential tools for anyone who needs to organize, analyze, or manipulate data efficiently. Their versatility and powerful features make them indispensable in both personal and professional meilleur.
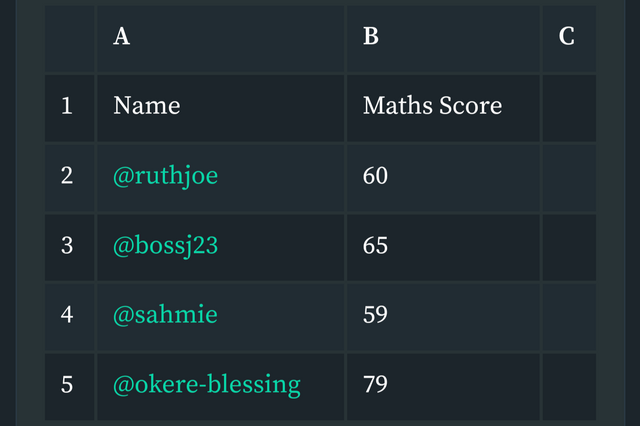
| Based on the basic Formulas given in this lecture, use the data below to calculate the SUM Function and the AVERAGE Function of the class. Showing clearly as how I managed to arrive at my answers. |
|---|
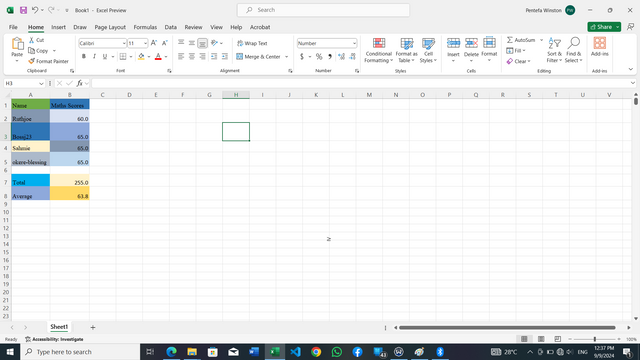
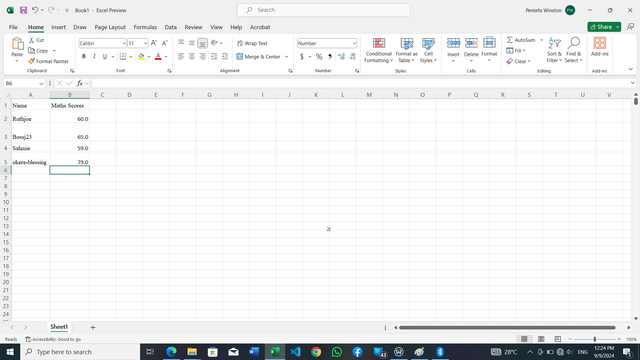
To begin, I start by feeling in the information in my spreadsheet. This is the results.
Next step, I proceed to add the section for the sum and average. While applying some colors to make my work beautiful.
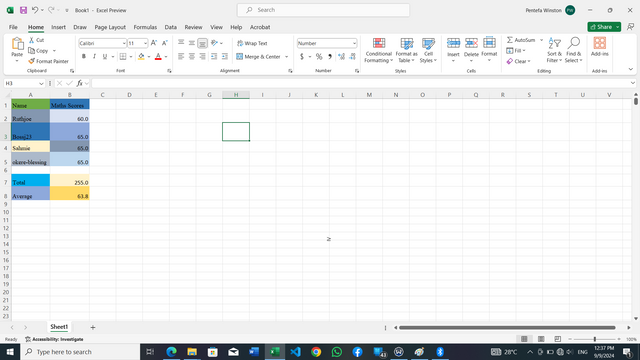
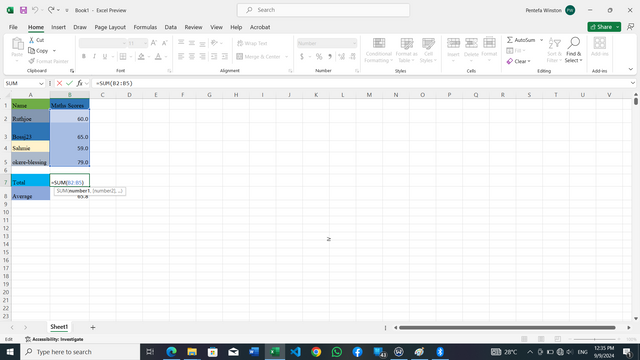
Next. In the remaining space, i input the remaining space the sum formula as seen.
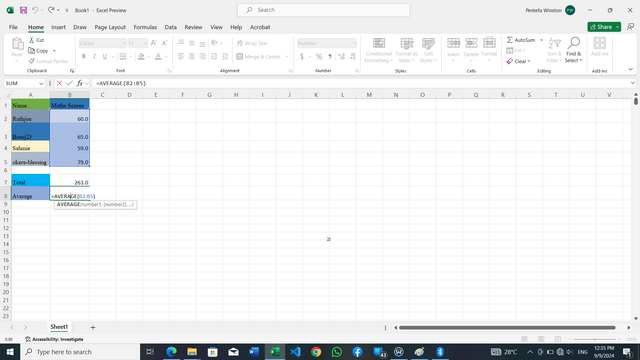
Equally, the remaining space, I input the average formula as shown.
This is a final result of my spreadsheet.
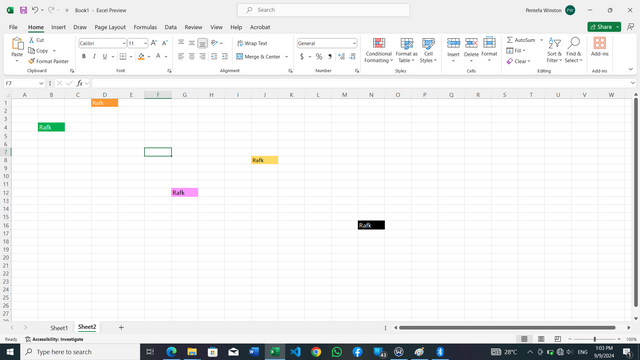
| Take a screenshot my worksheet and identify the cell Addresses of the following; N16 with a fill color of black, J8 with a fill color of yellow B5 with a fill color of Green G12 with a color fill of purple and D1 with a color fill of orange. Write my username on these cells using a visible font. |
|---|
| Prepare a score for 15 students where the cell A1 label will be Name, cell B1 label will be Maths Score, cell C1 label will be English Score, cell D1 label will be Physics Score, cell E1 label will be Chemistry Score and cell F1 will be labeled Total. Fill in all necessary information and calculate the total for each student's score . Demonstrate clear working. |
|---|
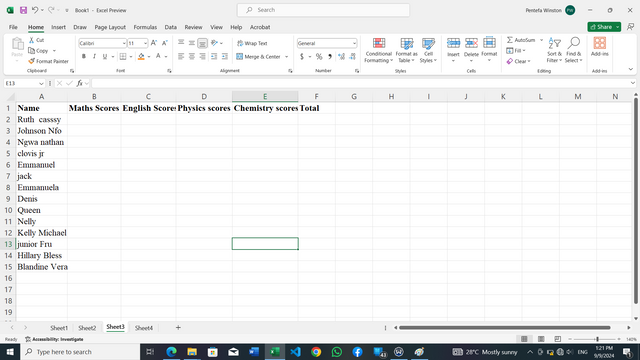
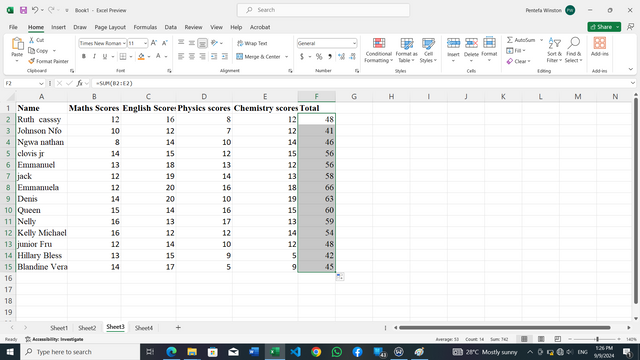
I began by feeling in the necessary work in my spreadsheet as instructed. Starting with the name and subjects.
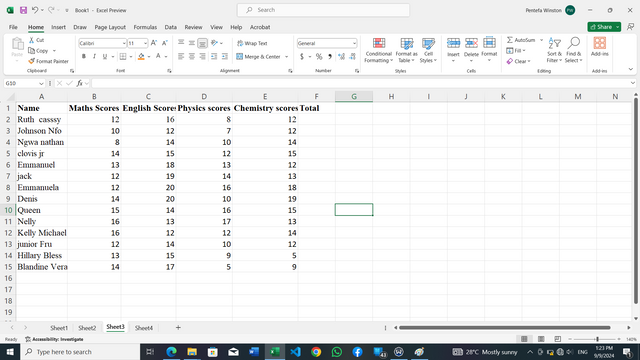
Next. I fill in the scores of the students and this is how it appears.
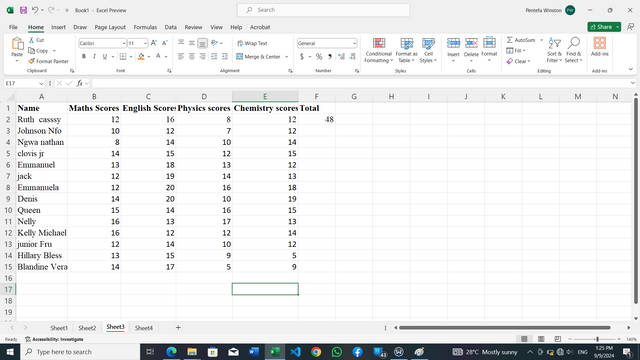 I began by putting in the formula in the first space
 =sum(E2:F2). Then drag it from the bottom left to feel in the total.
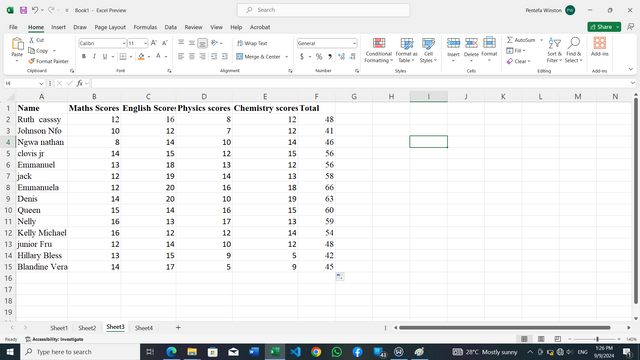
Here all the totals have filled automatically. I then click enter to affirm it. This is the final result below.
To conclude, i will say spreadsheet is a best way to begin with as of the digital economy especially as we are getting so dynamic with data analysis. I'm so have to begin with the contest and I will say I enjoyed a lot carrying out this exercise.
I will the invite the following persons to join me participate in this contest. @fombae, @sahmie and @chant.
Credit to: @rafk
Thank you, friend!


I'm @steem.history, who is steem witness.
Thank you for witnessvoting for me.
please click it!
(Go to https://steemit.com/~witnesses and type fbslo at the bottom of the page)
The weight is reduced because of the lack of Voting Power. If you vote for me as a witness, you can get my little vote.
Upvoted. Thank You for sending some of your rewards to @null. It will make Steem stronger.
TEAM 5
By completing your work , you have achieved your great remarks and I am happy to see your achievements it's really appreciate that you done your task very well. Wishing you very good luck
Las hojas de cálculo son importantes para la digitalización de tareas y la obtención de resultados precisos que a los humanos nos tomaría mucho mas tiempo y trabajo realizar.
De acuerdo a su ezplicación se puede apreciar que tiene algo de experiencia en el manejo de las hojas de cálculo.
Éxitos en su participación.