Read and Learn: #02 ~ Bitcoin Gold Price Technical Analysis – BTG/USD Upsides Remain Capped

There were a few upside swing moves in above $200 in bitcoin gold price against the US Dollar. The price tested the $240 resistance and failed to gain momentum. There were two attempts to trade past $240, but buyers failed to push the price above $240-250. As a result, there was a downside reaction below $230. It broke the 23.6% Fib retracement level of the last wave from the $145.01 low to $241.20 high.
More importantly, there was a break below a short-term bullish trend line with support at $225 on the hourly chart of BTG/USD. The pair even broke the $200 support once and the 100 hourly simple moving average. However, the $190 support prevented declines along with the 50% Fib retracement level of the last wave from the $145.01 low to $241.20 high. BCH is currently moving higher and is trading above the $200 level and the 100 hourly SMA.
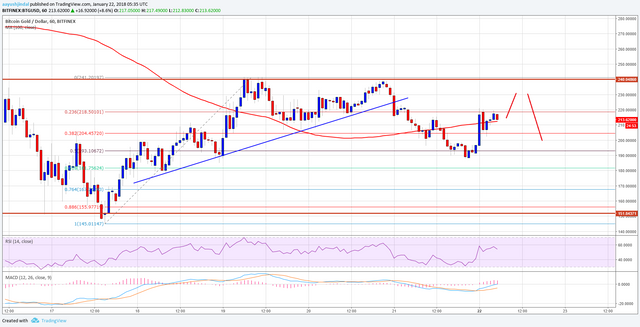
It could continue to move higher toward the $230 and $240 resistance levels. However, it needs to gain momentum above $240 to drift towards the $280 and $300 levels. On the downside, the $200 level is a short-term support followed by the $190 low.
Congratulations @exyle1! You have completed some achievement on Steemit and have been rewarded with new badge(s) :
Click on any badge to view your own Board of Honor on SteemitBoard.
For more information about SteemitBoard, click here
If you no longer want to receive notifications, reply to this comment with the word
STOP