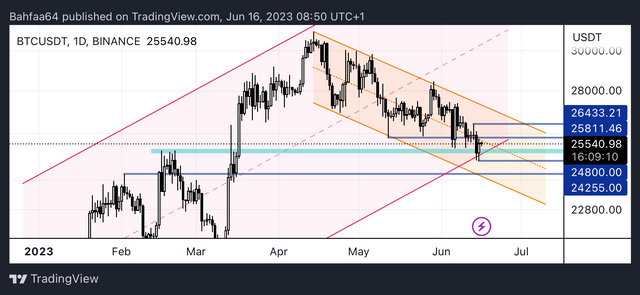
BTCUSDT / Technical Analysis in "Daily" time frame
Technical analysis of Bitcoin to Tether (daily time frame)
As it is clear in the picture, the price is moving inside a descending channel that started on April 14, which is a descending channel inside an ascending channel.
If the sellers can completely break and stabilize the support range of $25,200, we can enter a selling position after identifying the candle of confidence and according to our strategy;
But if the confrontation between buyers and sellers in the support range of 25,200 ends in favor of the buyers, the price will return and enter the upward channel again, but as long as the resistance price of $26,400 has not broken upwards, it cannot be said that the downward trend is over and the price will enter to it's upward trend .
So it will be risky to take a buy or sell position in the daily time frame before the price reaches the $26,400 resistance .
