BTC Broke the Trend and is now considered in Danger Zone ( short-term )
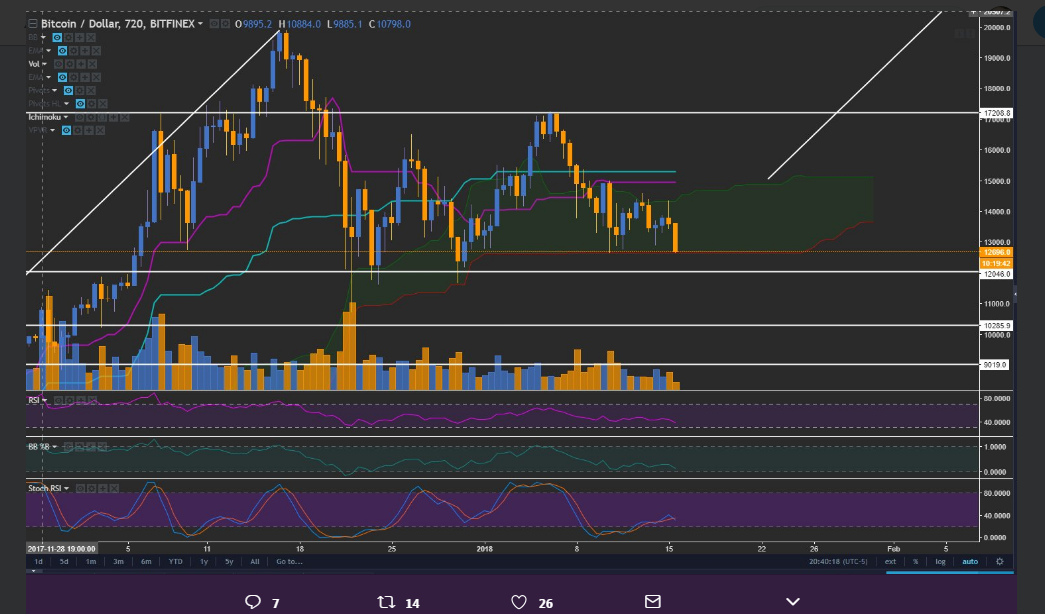
Based on the latest chart of Bitcoin, it looks like it is undergoing a major correction.
After hitting the highs of almost $20k, BTC has started to form a corrective pattern between $12k and $17k, and there could be more to come.
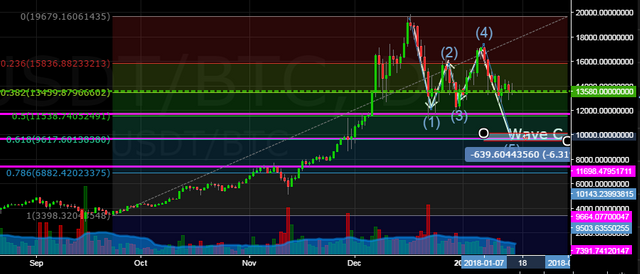
The minimum target for this pattern is 11500$.
If that is the case, the end of wave c will be around $9k, which is quite close to where the old trendline is( But I do not think we will head there )
Lastly, we also pulled out a Fibonacci Retracement on the whole price history of Bitcoin, and drew in a red rectangle to indicate the 50-61.8% retracement range. For major corrections, this is where it usually ends. If it breaks below the red rectangle, then it becomes a reversal instead of a correction. The red rectangle is between $7.5k and $10k.
For conservative long-term investor, you can wait to accumulate inside the red rectangle.
Our 1st Target to see is that BTC stay afloat above 14500 , If We cannot go up and stay within the 14500, we will surely we can see $11k but the chances are lower and there are many trend line getting support between 10 to $13k to give bounce and support
However, if price goes above point c (around $17k), then it would invalidate the pattern, and the uptrend would likely continue to surpass $20k, so I am prepared to buy on a break above $17k as well.
Hope this was helpful and you get the point
Now Smsh that Upvote Button for Daily Crypto Market Updates :)
This is the best post on Steemit. I gave you a vote now, ya heard?
thank you or your support