Bitcoin - Ethereum - Ripple - Bitcoin Cash Technical Analysis | 2 March 2018
Hello,
This is my first post and i hope you will enjoy and supporting me and my site :)
Bitcoin Technical Analysis | 2 March 2018
The digital currency Bitcoin (BTC) breached the bearish trend line on the hourly time frame during yesterday's trading and yesterday as the bear failed to break the $ 10 thousand area during yesterday morning trading.
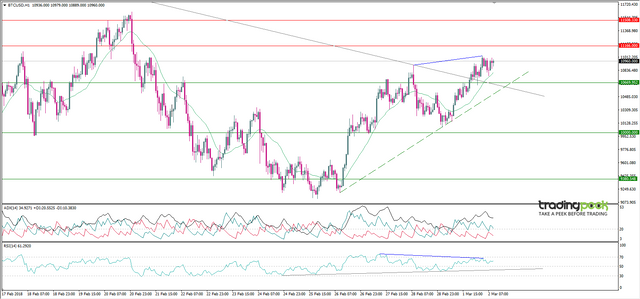
The largest currency in terms of market value is trading in an upward trend under formation, and the SMA 20 represents an important support area for the coded currency.
Momentum RSI 14 is trading in a bullish direction but the trend is weak due to a negative negativity bias in the first order formation.
It is expected that, in the event of the breach of the electronic currency Bitcoin to the level of 11028 may target areas of 11487 on the other side in case, breaking the encrypted currency levels of 10759 may target $ 10,309.
Support: 10669.95 - 10000 - 9380
Resistance: 11166 - 11508 - 12235
Trend: Down
Ethereum Technical Analysis | 2 March 2018
At the end of trading yesterday, the digital currency Ethereum (ETH) failed to break through the resistance zone of 871.35 $ and the encrypted currency failed to breach the broken bullish trend line as a result of weak bulls' determination.

Our neutral view of the electronic currency trading as a result of the lack of confirmation of breaking the rising trend line, and the simple moving average 20, neutral signal of trading in a specific direction.
The MACD with the regular settings so far is pointing down but needs confirmation.
It is expected that, in the case of breaking the digital currency ethereum $ 863.5 may target the area $ 854.12 while, in the case of a breach of $ 879.92 may target the currency $ 934.79.
Support: 817.14 - 721.54 - 641.03
Resistance: 871.35 - 906.03 - 955.85
Trend: neutral
Ripple Technical Analysis | 2 March 2018
After that, the redback currency Ripple (XRP) rebounded from the support area of 0.887 $ during yesterday trading on the 60 minute interval. The currency breached the bearish trend line at a large trading volume that the currency has not seen for nearly 10 days.
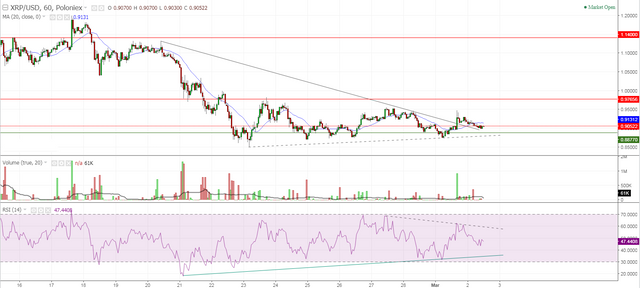
The bank-confident digital currency is retesting the bearish trend line and trading in a bullish trend under formation, and the SMA 20 represents a currency resistance zone.
Momentum RSI 14 is trading in a bullish direction. This trend is in a very weak position as it failed to breach previous peaks.
It is expected that if the default currency crosses the $ 0.9485 level, the currency might target $ 1.04, while a break of 0.8740 areas could target 0.8495.
Support: 0.8877 - 0.8161- 0.6304
Resistance: 0.9810 - 1.14 - 1.42
Trend: Up
Bitcoin Cash Technical Analysis | 2 March 2018
Our view of the virtual currency Bitcoin Cash (BCH) against the US dollar as it is trading in a narrow range between the areas of 1237.6 $ and up to $ 1308.4 areas on the interval 60 minutes.
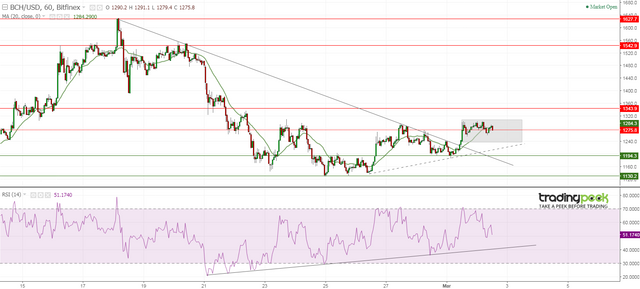
The simple moving average 20 indicates a neutral trading result with price action.
Momentum Relative Strength 14 is trading in a bullish direction and is suffering from weakness due to weakness of the current bullish trend.
It is expected that, in the event of a breach of the digital currency Bitcoin Cash $ 1308.4 the currency may target the region $ 1392.5 while, in case of breaking $ 1237.6 the currency may target $ 1144.1.
Support: 1194.26 - 1130.16 - 994.22
Resistance: 1343.88- 1542.90 - 1627.74
Trend: neutral
I hope guys you enjoyed and hope the market will fly :)
Thanks for supporting me and my site :)