BTC/USD technical analysis
Review:
In the last analysis, it was said that Bitcoin should move towards 4100 , where the start of a new upward wave towards 4555-4600 can be expected.
Forecast:
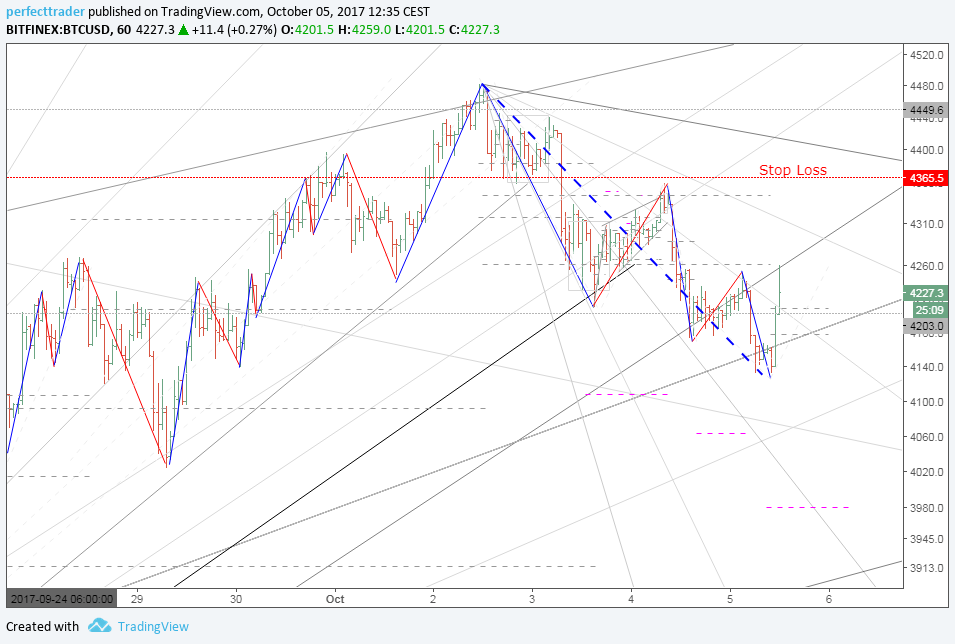
The correction (dashed blue) already may have ended and 4100 may be out of reach for this wave. If 4365 is exceeded, this would confirm the assumption and make a test of 4449 probable. A crack of 4449 would suggest a movement towards 4555-4600. We are sticking to the assumption that in this scenario, the range around 4555-4600 is likely to start a new downward wave.
As long as 4449 is not exceeded, a break of 4167 would be a signal for a test of 4131, and a break of 4131 would extend the correction to the support area 4100-4000.
Conclusion:
The stop loss for remaining short positions can be maintained in the range around 4360-4365. If 4365 is exceeded, short-term oriented traders can look for long signals. Target range is 4555-4600.
BTC/USD 60 minutes chart

German version at: http://perfect-trader.com/chartanalysen/bitcoin/1454-btc-usd-bitcoin-chartanalyse-05-10-2017
Stop loss 4365 is still active.

If it holds we will see a dynamic down wave