Forex Signals US Session Brief, January 17 – Bitcoin Breaks $10,000
Yesterday was the worst day for Cryptocurrencies since the beginning of this market. Bitcoin touched the $10,000 level and quickly jumped upwards. But today, cryptocurrencies continue the bearish trend and the $10,000 was finally broken for a moment. Is the run in cryptocurrencies over?

The tumble in Cryptocurrencies continues
Cryptocurrencies Continue the Bearish Trend
Yesterday was definitely the worst day in history for the crypto market. Most of the major digital currencies ended the day 20% lower, more or less. The daily bearish candlesticks in December 22nd are bigger if we take into account the shadows/wicks. However, all cryptos reclaimed more than half of that day’s losses, while yesterday, the price closed near the lows. This makes yesterday the worst day.
Different countries are trying to bring the cryptocurrency market under regulation while others such as South Korea and China are banning them altogether. I don’t think you can completely ban a digital currency which has no central institution, but the regulation will definitely increase. The reason they claim is money laundering, which at the moment is not that difficult to do with these new currencies.
A Bundesbank official had called for a unified global effort on regulating this market. It seems like cryptocurrency traders don’t like the regulation, so the downside is continuing further today.
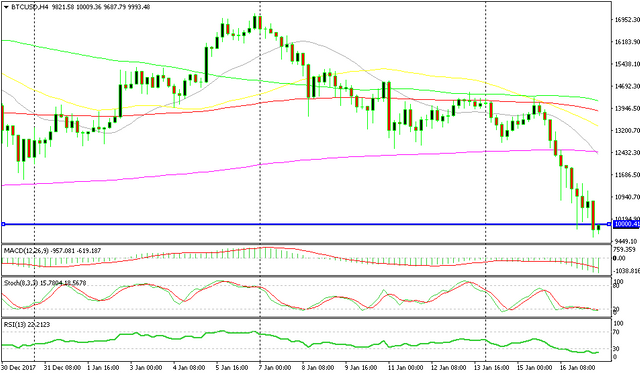
Bitcoin broke below $10,000 and reached $9,850 according to my broker’s platform. Although, the price didn’t stay there long and it quickly jumped to $11,380.
After the sellers reached the $10,000 level, we hoped that the downtrend was finally over. But today the decline is stretching further down and Bitcoin has broken the big support level at last.
Our long-term buy forex signal in Bitcoin doesn’t look great. Although, the cryptocurrency market is not dead yet. Let’s see how it evolves in the coming days.
Is the Reverse Underway for USD/JPY?
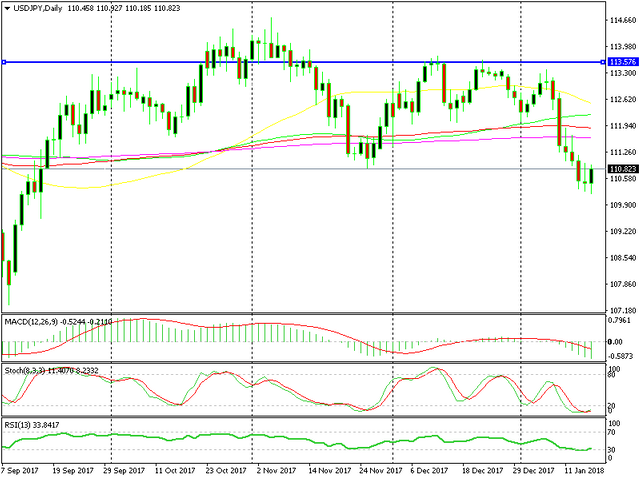
USD/JPY has been the leader during the latest attack on the USD. The Buck has lost about 300 pips against the JPY in the last several days.
On Monday, the sellers took us down to 110.30. The price retraced higher that day, but yesterday the sellers returned and took us closer to 110. Regardless, the support survived again and now we are back up, near 111.
I highlighted the 110 level a few days ago as a big round number that everyone was looking at. Well, it seems like this level might be the turning point for USD/JPY. The daily chart is oversold and the 100 SMA is providing support down there on the weekly chart.
Yesterday’s candlestick is another bullish signal. It closed as a doji (a reversing signal after a downtrend). The downtrend of the last several days has run its course on this chart, so the next move should be up towards the top of the range.
Is the Reverse Underway for USD/JPY?
USD/JPY has been the leader during the latest attack on the USD. The Buck has lost about 300 pips against the JPY in the last several days.
On Monday, the sellers took us down to 110.30. The price retraced higher that day, but yesterday the sellers returned and took us closer to 110. Regardless, the support survived again and now we are back up, near 111.
I highlighted the 110 level a few days ago as a big round number that everyone was looking at. Well, it seems like this level might be the turning point for USD/JPY. The daily chart is oversold and the 100 SMA is providing support down there on the weekly chart.
Yesterday’s candlestick is another bullish signal. It closed as a doji (a reversing signal after a downtrend). The downtrend of the last several days has run its course on this chart, so the next move should be up towards the top of the range.