Week analysis (W1) of BTC/USD from 05/07/2018 to 05/13/2018
Week analysis (W1) of BTC/USD from 05/07/2018 to 05/13/2018
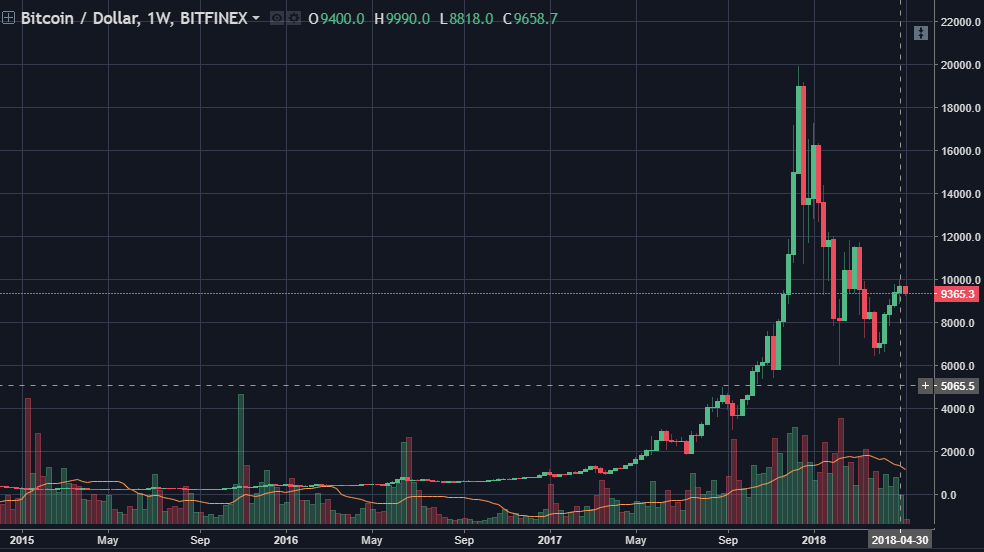
Price: Open last week’s price at $9400, then BTC dropped to $8818 and quickly rebounded to $9990 and closed the week at $ 9658 (on the Bitfinex).
Volume: Thus, with the trading volume was not big enough even the price increased, the temporary uptrend is not sustainable.
Candles: On the week frame we have 5 green week candles. Therefore, a correction of a weekly candle is also necessary to create sustainability for the next bullish trend. It has been a long time since we have had three consecutive weeks of rallying and this time we have seen that the BTC has risen for five weeks, indicating that the uptrend is fairly stable and could be maintained over time.
After nearly touching the psychological $10000, BTC quickly fell back and expect a correction before a correction before the BTC increase again.
The price is still below the Bollinger Bands, so the trend is still not strong. Bands on the down, bottom bands are moving sideways and the slope is gradually decreasing, so if the BTC is coming up then the path will be easier than the previous one.
Price after approaching the Fibonacci support level 78.6% and current price is fluctuating around 61.8%. Thus, this retracement from the peak of $19891 to the low of $6000 is acceptable for the correction wave.
Consider the ichimoku we see that this week Tenkan-sen has broken down to $8200 and the price is between Tenkan-sen and Kijun-sen so if BTC closed this week over $8200, then BTC will continue to keep up momentum . In case BTC closed the candle below $8200, then finished.
ADX 3 lines have not yet announced clear trend. Therefore, the ADX is telling us that the market is still Sideway. However, my personal opinion still prefers uptrend in the coming time.
Stoch is in the process of correction.
The MACD is turning up. However, the two MACD lines are still above zero and the histograms are negative, but they are shrinking. I still expect the next two lines MACD this cut up and BTC continue to journey to determine that the king of the market Crypto.
The money flow is still quite strong when the MFI is 55. The money flow is quite good for BTC's rise in the coming time.
CONCLUSION: So after the BTC has reversed ABC's correction to 78.6% of Fibonacci, the 3-candles Morning Star candlestick pattern is expected to start rising from this position. If the 2018 Crypto market continues to boom as in 2017, the BTC will reach $28,000 higher at $42,000 and reach Max at $64,000.
So, What's your plan?
hey you must try this they are offering free 30 days upvote service for limited time. i am using it for 2 weeks, They upvote my every new post Click here to see the offer