BTC price trends
Hey guys,
As mentioned in the last post that I'd do some price trend analysis on BTC. So here goes:
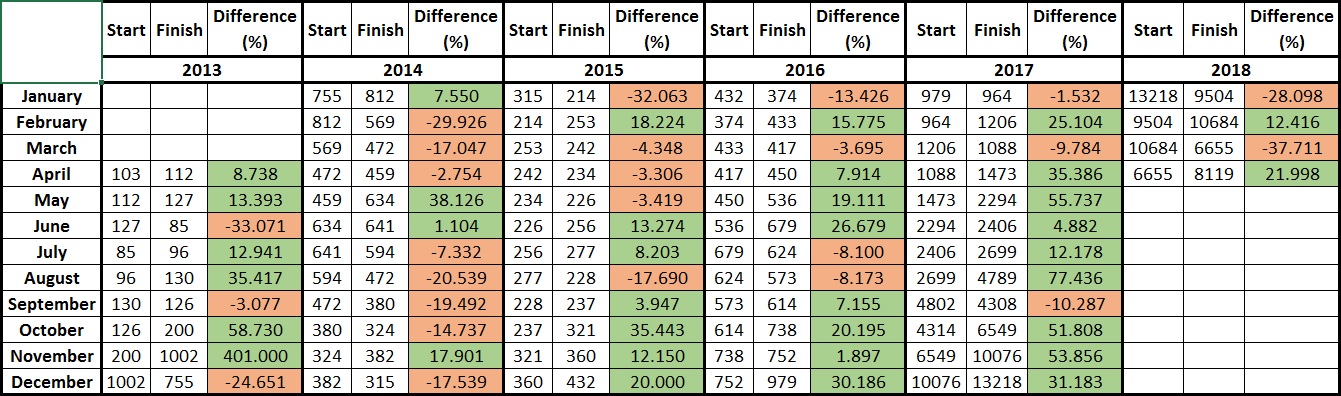
First chart: This shows the price action of BTC each month since 2013. But please note that (1) the website I'm using only does the last 5 years and so Jan, Feb and March of 2013 are missing, (2) the prices from 2015 onwards are based on 4hourly prices and prior to that is daily (the website wouldn't give me 4hourly before 2015) and (3) April 2018 price of 8119 is as of 16th April 10:30 GMT time).
From the below chart I personally can see the following:
The months where BTC falls are generally: Jan, March, Aug and Sept.
2014 was when BTC was in a bear market and we can see that 8/12 months of that year were "fall months". By 2015 that decreased to 5/12 months, 2016 - 4/12 months and by 2017 it was 3/12 months. Now so far we've had 2/12 months and so maybe if we're to continue this overall bull trend we can have only 1-2 months of bear months this year?
Some people have been comparing the current bear market with the 2013/2014 bear market and I previously already did a post on that. But using these figures I'd like to mention that BTC increase 400% in Nov 2013 alone (!) whilst the price increase in late 2017 (which saw BTC at $20k) was spread over 2-3 months and percentage wise it was no where as crazy IMO. So in my personal opinion the current correction should (and hopefully) not be as severe (in terms of price drop and the length of the bear run).
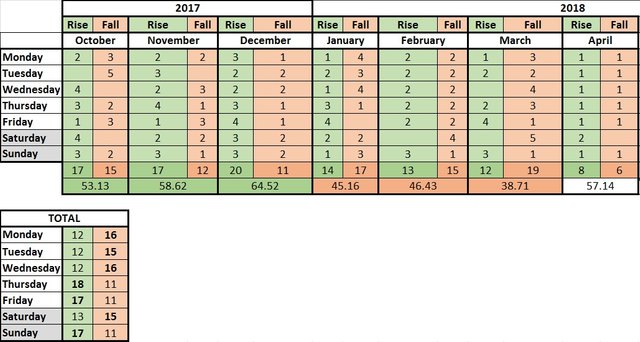
This second chart shows (1) how many BTC price rise and fall days there were in each month since Oct 2017 and (2) which days had the most price rises and falls. Please note that (1) those are based on 4hourly price movements for each day and (2)for April its up to 16th April only.
So from this I personally see:
The bottom role on the 2017/18 chart shows the percentage days that saw BTC rise, e.g. the first figure for Oct is 53.13 which means that was the percentage of days that BTC increased during that month, whilst in March it was only 38.7%
So we can see that it peaked in Dec 2017 at about 64/5% and has been dropping to last months low of 38.71%. At the moment April is at 57%. Lets see how the second half of this month performs before we can see if the trend might be reversing.The second chart shows that the days when BTC generally falls are: Mon, Tues, Wed and Sat. This sort of comes close to my analysis in one of my very early posts that BTC tends to rise between mid to end of the working week, i.e. Wed to Fri.
Hope you've enjoyed this. Again this IS NOT trading advice.
Thanks
@BlogBooster and my curation trail gave you multiple upvotes for this great post.
Have a great day!
Thanks!