My Crazy BitCoin Chart
My Crazy BitCoin
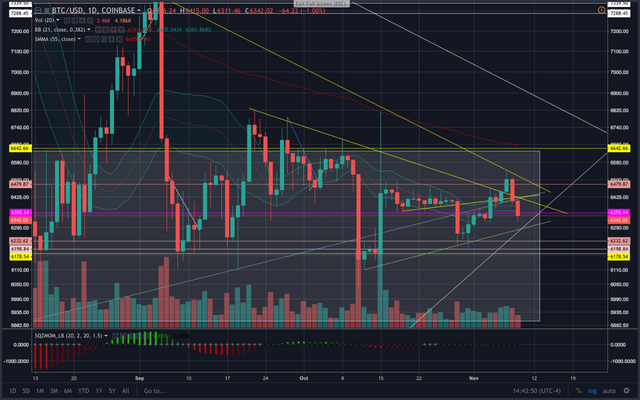
So yeah, this is my crazy BTC chart. I bet it looks much like yours but maybe cleaner. This is a day chart starting sometime in the middle of August. I have a couple of indicators that i have been living by, A 55 Smooth Moving Average and Bollinger Band set to length 21 and a dev of 0.382. I use them to follow the trend, make entries and exits. My trend lines do come into play in interesting ways, but it is a lot of folklore and magic in them lines! I have recently found a trading system that works, feels comfortable, makes sense, and is to legit to quit. #Hammer
If anyone is interested in learning moe about how i use these indicators and trendlines, ask away! also it is obvious that i am not giving advice as i have not given any here. as well, the way i use the indicators is basic logic and commonsense. Commonsense is sometimes hard to see until you see it.
Happy mad luck trading!