BTC update 11.02.18
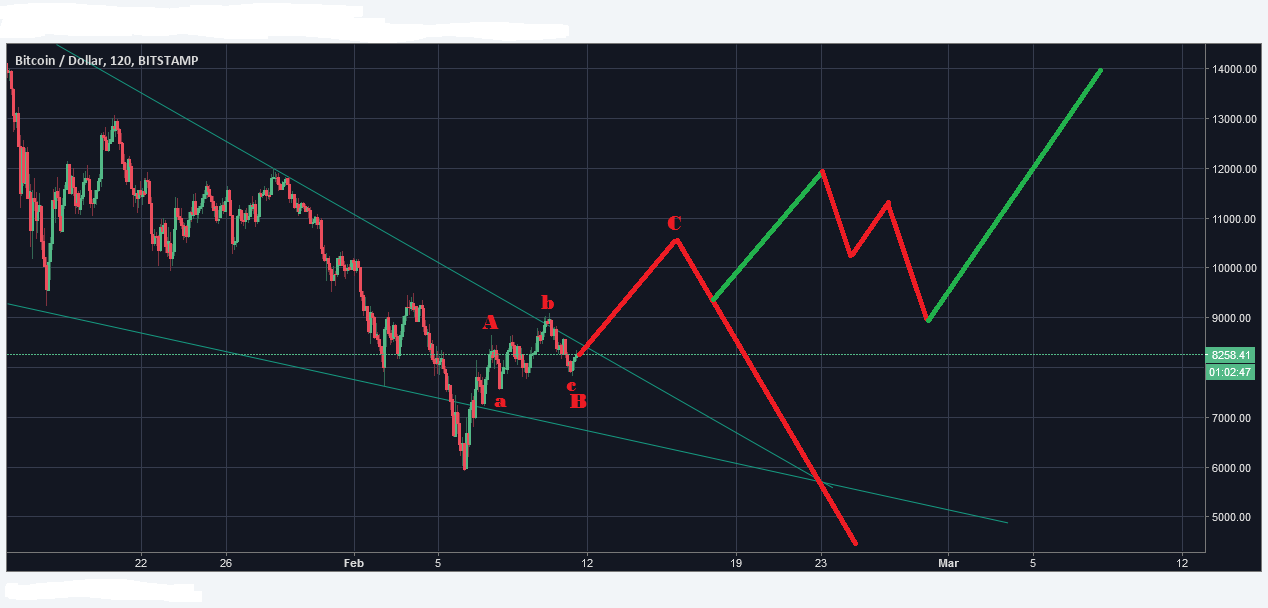
Wave B seems to be done now. My new target until friday is 10,000$ - 10,500$ BTC
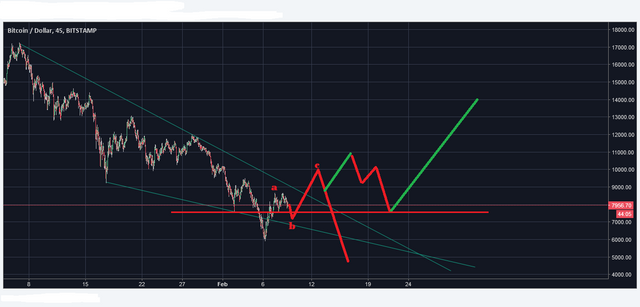
The trendline was breached a little, but we have seen another fake breakout in wave b of B and the decline in wave c of B that followed. Now wave C should be next.
I am happy to tell you, that we are also seeing strength in the prices of SBD and STEEM and that I will make an update about it in the coming days.
XRP might have seen the bottom already @ .56$ and the signs are increasing that BTC might also have found the low @ 6,000$. Why? We saw a big volume spike in the low as it should be. But more importantly the price is very stable with good patterns forming.
I am still cautious, but my bearishness is gone for now as I feel neutral towards the price action. I will just wait it out and count what happens... Stay tuned...
.png)
If you think this to be useful information:

.png)
Feel free to use and share my charts, but please mention me, @ew-and-patterns as the author. Otherwise it is considered plagiarism and I will flag you and advise my friends to do the same.
.png)
MUST READ!
DISCLAIMER: This post / analysis serves general information purposes only. I am not, and never will be a financial adviser. The material in this post does not constitute any trading advice whatsoever. This is just the way I see the charts and what my trading ideas (from my personal experiences) are. I use chart pattern and Elliott Wave analysis for my trading ideas.
For full disclosure: The author of this post is holding positions in this market at the time of this post. Please conduct your own due diligence, if you plan to copy anyones investment decisions!
If you make any trades or investments after reading this post, it is completely in your own responsibility. I am not responsible for any of your losses. By reading this post you acknowledge and accept to never hold me accountable for any of your losses.
Please consider leaving a comment, like or resteem, if this post entertained you or helped you see things differently...
Have a nice day :-)


my target is $ 100,000
Let's not get crazy before the impulse has even begun. It is possible though.
I agree I think we have seen the lows now. When things pick up there are a lot more people able to access crypto, so we could see greater gains but I think that will take time.
Nice update, brother! Still a bit confused as to your take on the move up from the $5920.72 low. Is it bullishly impulsive, or bearishly corrective?
I've just posted my take on the said price action in terms of an "hourly chart." You can check it out at the link below, which also includes a Chart-Cast "video" update on all the latest goings on...
I look forward to your response and clarifications with regard to the above. Much love, brother!
https://steemit.com/btc/@passion-ground/btc-elliott-wave-price-targets-and-chart-patterns-plus-a-chart-cast-video-overview
Your d wave (I call it wave 4 of C) does not look harmonic to me. That very short wave c of your d wave is why I am discarding this until proven to be correct.
I am not sure if it is an impulse or a correction. That is why I marked it ABC with the chance of relabeling it 1-2-3-4-5 if we see another move up after wave C. The other possibility that you pointed out already is, that wave 1 is already in @ your wave d level. This would mean that wave 2 follows.
I can't really say why, but my gut tells me this is going to be one of the bullish scenarios. I am staying neutral until confirmation. Thanks again for your video. Please keep it up at a pace you are comfortable with.
Thanks for clarifying that for me, friend. Thank you as well for the encouragement!
Thank you for information..
I think bitcoin will struggle to make the crazy gains it has seen in the past year. Its just so unfunctional. Steem however has a bright future ahead and a big couple of years coming.
You are talking about fundamentals. How does that relate to the EW analysis consisting of drawing random lines?
But they're so colorful and pretty, they must be doing something.
This may be true, but even if it is half as crazy gains or 1/4 as crazy, that's still pretty damn good
thanks for sharing it, great information.
i see the head and shoulders on the fourtly
If you mean inverse H&S, then I see it too.
nice ew technique.. but i think it still not meet it deep yet.
what do you think is possible for march ? I guess 15k easy
$10k target?
It's too much. I think btc can cross only $9k.