BTC update 07.12.17
BTC hit 16000$ and started a correction afterwards.
If you think BTC is going crazy right now, wait for 2018. If you did not notice it yet, I have to tell you that we are in an extended 5th wave. What does that mean?
Have a look at the BTS chart for a good example of an extended 5th:
After an extended 5th you sell, all of it! If not, you will get burned and your profits could even turn into losses.
Extended 5ths tend to have very big corrections afterwards. It was the same thing in BCH when it dropped hard from 2800$. There are many more examples of this. Remember to always sell into an extended 5th. You will likely miss the top, but you won't be shocked by the mother of all DROPS! And that is the most important thing. You can always buy back cheaper after a reasonable correction, if you already have locked in some nice profits.
I would rather lock in a few thousand $ profit than risking to loose it all again, and it could be happening very quickly.
Today BTC dropped nearly 3000$ in 30minutes. Let that sink in for a minute. This is now considered a standard drop. A wave A of a correction...
I am sure though that it will be just a correction this time, but at some point in the future it won't be. A 50% drop will happen at some point.
If you are still with me after all warnings, here is your reward, the updated BTC count:
When I see this chart, sell in may and go away is all I am thinking.
If you think this to be useful information:
Feel free to use and share my charts, but please mention me, @ew-and-patterns as the author. Otherwise it is considered plagiarism and I will flag you and advise my friends to do the same.
DISCLAIMER: I provide trading ideas using EW and Pattern analysis. The material in this post does not constitute any trading advice whatsoever. This is just the way I see the charts and what my trading ideas are. The author of this post is holding positions in this market at the time of this post. Please conduct your own due diligence, if you plan to copy anyones investment decisions.
If you make any trades or investments after reading this post, it is completely in your responsibility. I am not responsible for any of your losses. By reading this post you acknowledge and accept that.
Please consider leaving a comment, like or resteem, if this post entertained you or helped you see things differently...
Have a nice day :-)
People that don't believe Bitcoin will have a correction are going to get badly burned 🔥
34k btc is a scenario i would love to see in 2018. Locked in some profits on the rise. So its Popcorn Time =) . BTW love you 5th chart.
I bought some today so that I can sell them later when the price is higher. It has already climbed 1000 euros since then. But I'll heed your advice, since you are an expert :)!
Remind me in 5 months!
I transferred almost all my bitcoin to coinbase thinking they are the most liquid to sell ...the site decided to stop working when it was over $19k ...
Shady business!
We still have more room to go before big correction - best thing to do is sell before and avoid ‘site crashes’
Your guess please
After the 5 of (5) of V of (V) is in. Do we see the major correction to prior wave IV $200 as per Elliot wave states
Or we get a massive sell off to .38 - .61 fib retracement ?
Thx
Again. Elliott Wave does not state that it goes back to wave IV level. THAT is just haejins observation in cryptos. Only in cryptos. No elliott wave rule at all!
In my opinion wave IV is not at $200, but that is debateable. Let's just say I would not be shocked to see it fall back to $6666.
not talking about Haejin , and I don't know what he thinks ...

I was just trying to get your opion is all and not advice .
I pay for a Elliot wave service and get updates frequently ..and happy with them
this is a sample of the bigger picture
also the prior wave 4 correction after 5 is a thing I thought you were aware of
pic below shows after every 5 it retraces to 4 or close to it .
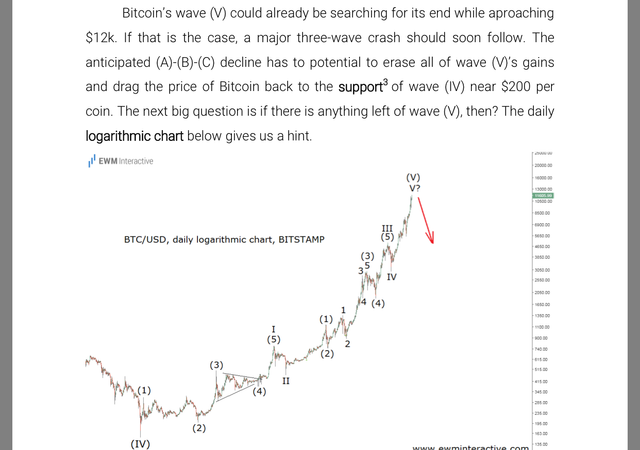
"Bitcoin’s wave (V) could already be searching for its end while aproaching $12k. If that is the case, a major three-wave crash should soon follow. The anticipated (A)-(B)-(C) decline has to potential to erase all of wave (V)’s gains and drag the price of Bitcoin back to the support3 of wave (IV) near $200 per coin. The next big question is if there is anything left of wave (V), then? The daily logarithmic chart below gives us a hint. "
this is just a bigger chart and a sample , I get updates twice a week
if all the small 5 retrace to 4
then big five should retrace to big 4 witch is $200.
not saying its going there but that Is what has been happening, again I thought you were aware of this . thanks for your opinion .
I don't know what this guy is talking about. It is not an official rule as of my knowledge. I never heard or read it before heajin said it in a few videos.
I am aware of this log chart, but I think log charts are bullsh.. It is in direct conflict with the linear version. Also wave III in this log chart is small and could easily turn out to be just another wave 1 extension inside bigger wave III
I seriously doubt that this could ever happen to BTC. Now that the media is going crazy, big hedge funds and banks are just starting to pump their billions in.
A big correction is coming after the top, that is clear.
haejin showed this logchart 3 months ago...
The chart is from The site that I have a subscription to and others .
Where do you think some got the big crash idea from ?
$200 is ridiculous and I i know it -especially now .
The log chart is just showing the big picture- all the waves -
The service gives close ups weekly charts ..
I’ll keep you in the loop if you care , but looks like you know excatly what’s going on ...
i did one search and i found this
http://stockcharts.com/school/doku.php?id=chart_school:market_analysis:guidelines_for_applying_elliott_wave_theory
In this pic wave 4 is between the 38% the 50% RT which is a frequently hit correction target. I don't get why they would illustrate a guideline of wave 4 span, when a wave 2 can retrace anything between 23 and 99.9% and the 50 and 62% RT are the MOST frequently hit targets.
But OK, I guess this is another way to combine fib ratios with support and resistance levels.
Thanks for your input .