BTC update 06.02.18
Yes, the low could be in already. In fact yesterdays target 6,000$ was hit perfectly and BTC started turning.
But on the 2 hours chart and above, it looks like another low is needed to complete the pattern.
In fact a lot of people are waiting for this turn. This is why I favor another fake breakout in yellow wave 4, before a real turn happens.
For maximum pain, BTC could enter the triangle again, but bounce off the upper resistance line like this, right before dropping to the final low at the next support level which is expected to be 4,800$.
You can call me genius now. I still don't get how anybody can doubt that this is legit, because I have been showing some incredibly accurate shortterm price pathways like this one... precision hit once again. Of course it does not always work out as good as this example, but a few gold nuggets are enough to buy a house.
I gave you two price pathways, that did not differ much from each other, and the first one which I favored happened like I predicted. For me, this alone is confirmation enough that my count is right so far.
Here is another one for your enjoyment:
And another one:
And another one:
If you think this to be useful information:
Feel free to use and share my charts, but please mention me, @ew-and-patterns as the author. Otherwise it is considered plagiarism and I will flag you and advise my friends to do the same.
MUST READ!
DISCLAIMER: This post / analysis serves general information purposes only. I am not, and never will be a financial adviser. The material in this post does not constitute any trading advice whatsoever. This is just the way I see the charts and what my trading ideas (from my personal experiences) are. I use chart pattern and Elliott Wave analysis for my trading ideas.
For full disclosure: The author of this post is holding positions in this market at the time of this post. Please conduct your own due diligence, if you plan to copy anyones investment decisions!
If you make any trades or investments after reading this post, it is completely in your own responsibility. I am not responsible for any of your losses. By reading this post you acknowledge and accept to never hold me accountable for any of your losses.
Please consider leaving a comment, like or resteem, if this post entertained you or helped you see things differently...
Have a nice day :-)
If BTC hits sub $5000...I am definitely buying more.
It has been a nice little rebound. Looking forward to brighter days.
Here is my vision (the 15 min chart). I see the first impulse here, and it can be developed to both 5-3-5 link between two ZigZag's in double ZigZag Pattern, or the 5-3-5-3-5 -> to the moon.
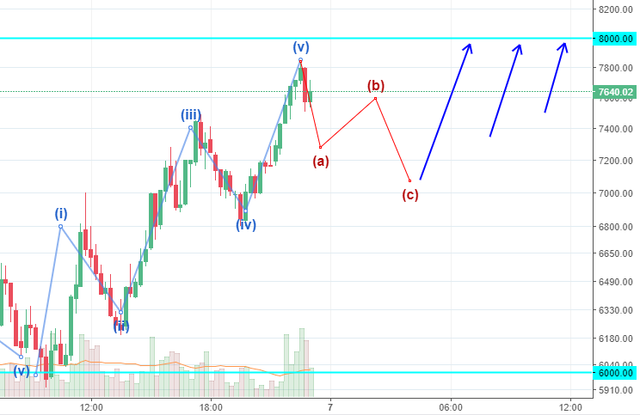
My monitoring is aimed at the intensity of testing $8 000. If we test hard - Impulse. If there will be no hard-on on that goddamn sexy level -> 2ZZ.
More info can be found at my today and yesterday posts.
Thanks for the analysis, @ew-and-patterns! Proper job returns great results!
good! That is exactly the point. 5-3-5 drop or 5-3-5-3-5-ABC
I have a quick question on your first H&S chart and its suggested target of $2800. The Head is at $17,234.99, correct?
If so, then at what price point do you have the "neckline" occurring on January 6th, the day the "head" was established?
I calculate a neckline of roughly $10,147, which would translate to a height distance of roughly 7,087 points.
Basis the height in which you've calculated, what do you then have as a price point for the "Neckline breach on Feb-2?"
I have a rough price point for said neckline breach at about $8,043...
If you concur that $8043 (or thereabouts) is where the first breach of said neckline took place, and that the originating conventional "neckline" is in the vicinity of 10,147, then the classic (potential) price target from the said breach, which would be 7,087-pts beneath the point of the breach, should imply a potential downside target of $956. Yes, or no?
8043 (neckline breach point) - 7087 pts (height of Head to Neckline) = (potential downside target of) $956.
Just wondering if I'm missing something - or what price points it is that you are using to arrive at your stated $2800 measured target.
Thanks for your patience with this question, brother.
There are different ways to measure the target. You add the height of the neckline to the point of breach and get 956 as the target which is the classic approach. That's correct, but because I have seen a lot of H&S miss this target, I measure the minimum target differently. As you can see, I just project the height in the same angle downwards which leaves me at a minimum price target of 2800. It can be exceeded easily, but the probability of a legit H&S hitting this target is higher than hitting your target of 956.
That's all about it. Just a more cautious measurement. When analysing for an audience, it is always better to have the target exceeded, than missing the target ;-)
I hear you, brother! Thanks for clarifying your position... It is always a good practice to "under promise" and "over deliver." -
For embracing that general posture - you get EXTRA ninja-level "kudos" points from me, friend!
As for the benefit of the wider audience, with a quite similar intent to inform without "over-promising" ... H&S patterns and the targets derived from such are simply "references" from which to monitor future price action. They are NOT absolute predictions as to what will indeed occur...
Looking forward to your continued assessments of the intra-day price action, brother. Thank You, man!
As I mentioned to you previously, I'm going to continue looking for your short-term takes brother. I.e. - for your intra-day assessments as to whether or not the move up off the recent 5970.22 low turns out to be impulsive or corrective. Got my eye on you, bro - and I ain't taken it off. You ROCK! :-)
I think you are right. It looks due to turn now!
They hate us for our Bitcoinz!
well for awhile now cryptocurrency is experiencing a meltdown crash. Don't know when it's gonna come up. With your legit algorithm about BTC fall in the market, i know better and believe for a rise soon.
This post was selected at random for a resteem by the Abasinkanga Resteem Service
I am not a bot. Upvote this comment if you like this service
it is most valuable information
thanks for sharing a useful information