BTC morning update 12.02.18
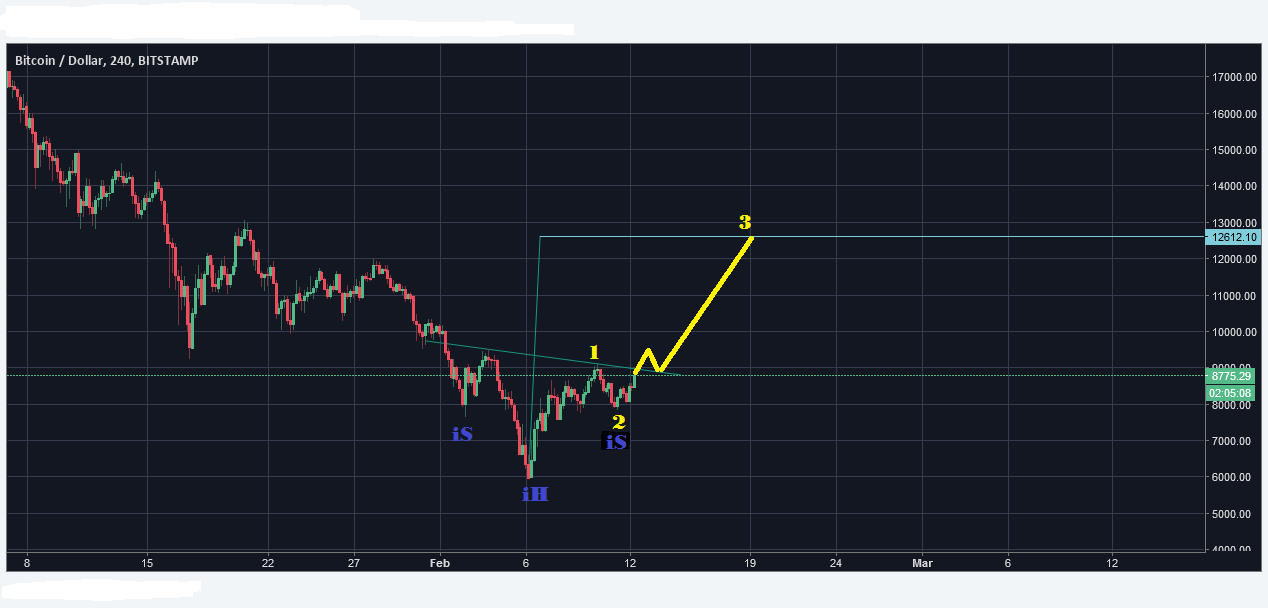
New pattern alert! BTC is forming a bullish iSHS pattern. If the neckline is breached significantly, the expected minimum target will be 12,600$.
If it is breached and afterwards the neckline is retested like this, it will give additional confirmation for this pattern.

If it happens like this, it will turn me from neutral to bullish again.
UPDATE: SBD retested the downtrend from above. A pump could be imminent in the next two days. BTC is touching the neckline again. Will we see a pullback first or a direct break through?
.png)
If you think this to be useful information:

.png)
Feel free to use and share my charts, but please mention me, @ew-and-patterns as the author. Otherwise it is considered plagiarism and I will flag you and advise my friends to do the same.
.png)
MUST READ!
DISCLAIMER: This post / analysis serves general information purposes only. I am not, and never will be a financial adviser. The material in this post does not constitute any trading advice whatsoever. This is just the way I see the charts and what my trading ideas (from my personal experiences) are. I use chart pattern and Elliott Wave analysis for my trading ideas.
For full disclosure: The author of this post is holding positions in this market at the time of this post. Please conduct your own due diligence, if you plan to copy anyones investment decisions!
If you make any trades or investments after reading this post, it is completely in your own responsibility. I am not responsible for any of your losses. By reading this post you acknowledge and accept to never hold me accountable for any of your losses.
Please consider leaving a comment, like or resteem, if this post entertained you or helped you see things differently...
Have a nice day :-)
Nice catch identifying that bullish inverse H&S pattern... Looks to be the potential for about 3400-pts of upside from the point at which the market is able to breakout above that falling neckline.
The trend has changed. It won’t be long until we need to strap in for the next ride.
Excellent analysis @ew-and-patterns.
I m still bearish...
i simply can not count the sub waves in wave 1 as an impulse. i can only see it as an ABC.... there are 8 waves( so not an extended impulse) and there is ton of overlap in it. And if i go to daily it looks like a 3 wave (ABC)
Maybe it's the inexperience :(
edit. let's see if it bounces of the support (that was the resistence) or if it falls back inside forming a bear wick....
Thanks for the message.
I liked it
SBD is increasing now ,again when it falls down.I want date ?
Thanks for the enlightening information...
Great, things are starting to look positive . Bullish on Bitcoin it's just a matter of time, be patient and HODL.
All in baby!
Tanks