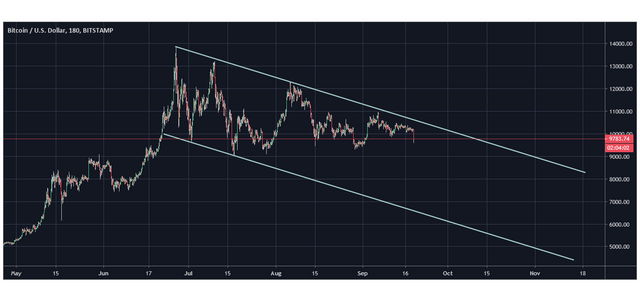
BTC emergency update 19.09.2019
UPDATE: THIS CHANGES EVERYTHING. We are still in a triangle... Update tomorrow. There are only three possible counts left. The crash will not happen in my opinion! I am sad. BTC might never go below 9600 again.
.png)
If you think this to be useful information:

Feel free to use and share my charts, but please mention me, @ew-and-patterns as the author. Otherwise it is considered plagiarism and I will flag you and advise my friends to do the same.
.png)
Please consider leaving a comment, like or resteem, if this post entertained you or helped you see things differently...
Have a nice day :-)
#bitcoin #btc #crypto #cryptocurrency #cryptocurrencies #steem #sbd #ethereum #eth #ripple #xrp #bitcoincash #bch #eos #litecoin #ltc #stellar #lumen #xlm #digibyte #dgb #cardano #ada #iota #tether #neo #tron #trx #omg #verge #xvg #bitshares #bts #nano #monero #xmr #dash #ethereumclassic #nem #binance #binancecoin #vechain #tezos #omisego #steemit #money #life #altcoin #altcoins #trading #investing #investment #investments #forex #forextrading #market #finance #gold #silver #commodity #commodities #stock #stocktrading #stockmarket #facebook #fb #apple #aapl #spx #xau #xag #usdjpy #usd #amazon #amzn

What's your opinion on BTC price at the end of the year @ew-and-patterns?
14k
Congratulations @ew-and-patterns! You have completed the following achievement on the Steem blockchain and have been rewarded with new badge(s) :
You can view your badges on your Steem Board and compare to others on the Steem Ranking
If you no longer want to receive notifications, reply to this comment with the word
STOPTo support your work, I also upvoted your post!
Vote for @Steemitboard as a witness to get one more award and increased upvotes!
Thanks for the update. Resteemed :-)
The lower trendline is only touched twice by the BTC price. This line seems rather arbitrary.
I see a triangle with your upper trendline and a horizontal line at around 9'200 (where the breakout end of June occurred and which has been touched at least 3 times).
I expect a breakout (to the upside, because I think we are in a bull market) about 2 weeks from now.
Sorry, but with this statement, you have clearly demonstrated that you don't know the principles of Elliott Wave Theory. This is called an Elliott Channel which is created when you copy the upper trendline to the lowest pivot points of the correction. This chart is not in log scale and should only demonstrate that the most likely downside of this move should remain within the channel. You can also call it an 80% channel if you want.
Your approach with the horizontal line is fine, but it completely ignores Elliot Wave principles and repetitive structure patterns. Also, your pattern with the horizontal line is a "descending right triangle" which breaks to the downside more often than to the upside.
No, you can't conclude that I don't know EW theory. I know it, but I find this theory rather arbitrary - just based on repetitive structures irrespective of asset-specific properties and market events.
Yes, it's a descending triangle. Concerning BTC it was (up to now) not that important if descending or ascending. If BTC was in a bear market the outbreak out of the triangle was mostly to the downside and in a bull market the outbreak was to the upside.
4 weeks from now we will know more :-)