The Bitcoin Trend - Update on Cycle Overlay
I wrote a post previously and required more data on the current cycle (cycle 3 on my posts) to get a better idea of where we are going - BTC - What's Your Take?. The first graph in the previous post (follow the link) show that there was almost a perfect trend towards the 5k range in cycle 3 where BTC reached the inflection point. I have adjusted the cycle 2, cycle 3 overlay which produced the below results.
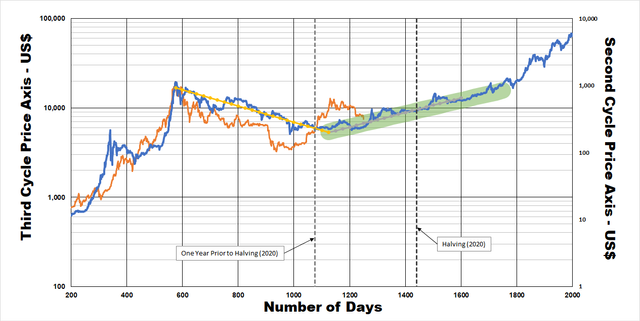
With today's massive spike in price we have again jumped to the upper limit of this predicted realistic BTC price range (Green bar in the above graph) but will most likely return to this range.
The graph also show that we will most likely only break the ATH a full year after the halving event of May 2020.

Consider donating should this post have been of value:
BTC - 18atWSWrN2bDxNWeoc3Q68coQBEk69FvUY
ETH - 0x71844057eec156843af64b2b8021daf3615b0e06
LTC - LPji8igXQ1cqjhZDFZUYgEWvVshGVi4AA1


PREsearch (My referral) - https://www.presearch.org/signup?rid=454926
Congratulations @dpl! You have completed the following achievement on the Steem blockchain and have been rewarded with new badge(s) :
You can view your badges on your Steem Board and compare to others on the Steem Ranking
If you no longer want to receive notifications, reply to this comment with the word
STOPVote for @Steemitboard as a witness to get one more award and increased upvotes!