BTC - New Attempt at Bottom Fishing
Downside Structure Complete, Positive Divergence In Place
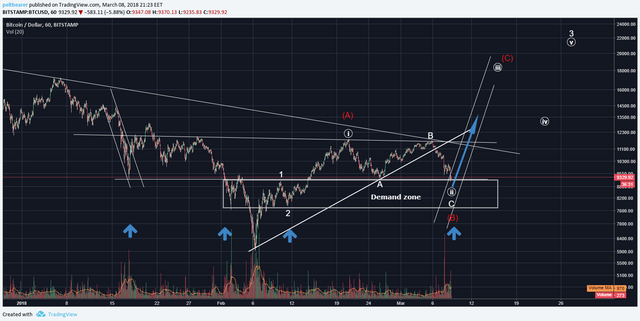
On the 1 hour chart we see that there still is a valid 1-2, 1-2 setup in place, i.e. the third and most powerful Elliott Wave would be next if correct. There is also nice symmetry - see the blue arrows. The most obvious inverse head and shoulders pattern didn't take off, as the market did just what it usually does, i.e. the opposite of what the masses think.
Also note the red count, which isn't as bullish, but still needs a C wave at some point!
Zooming in:
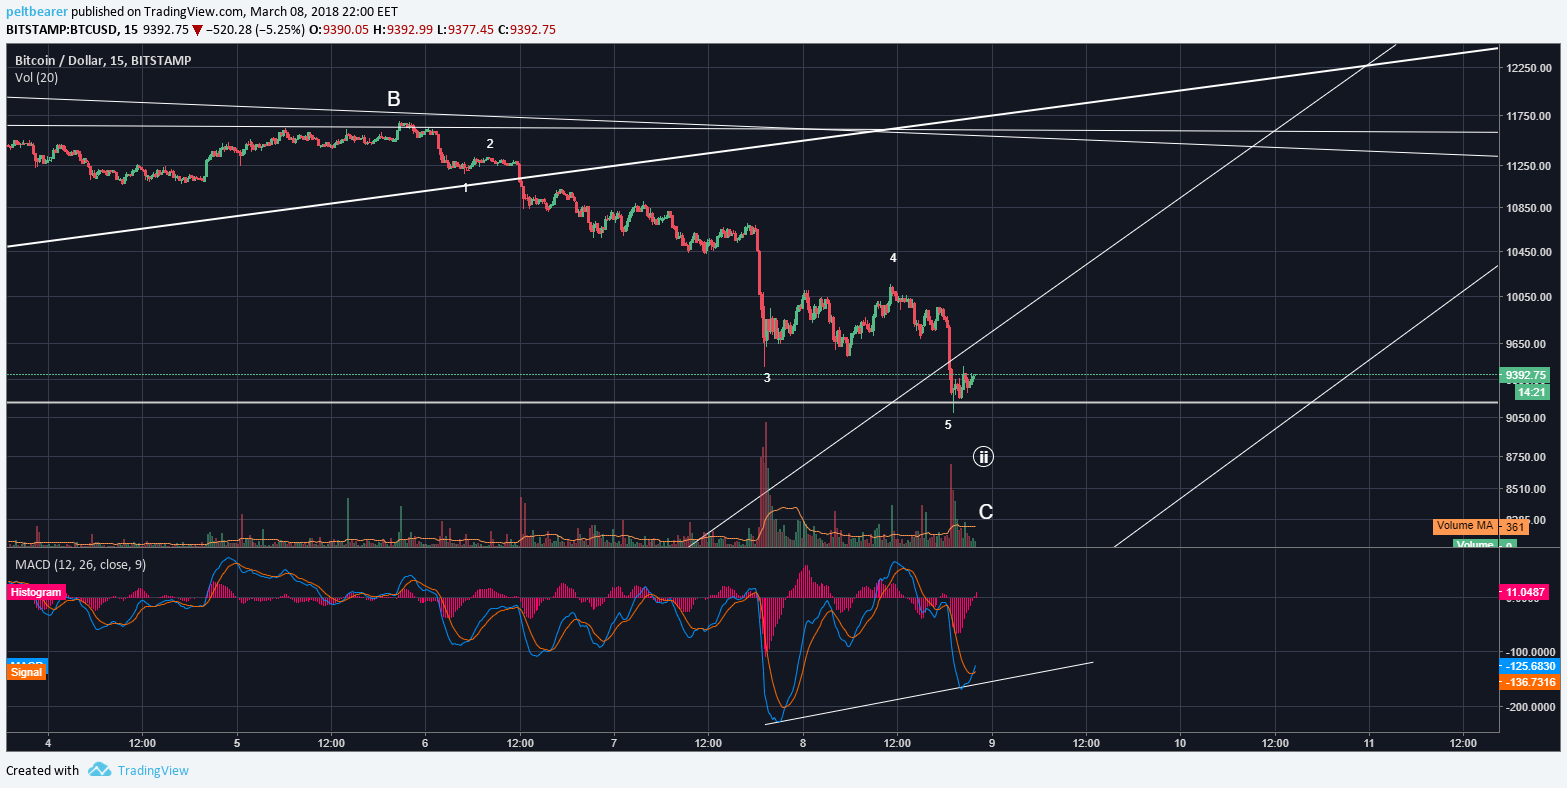
On the 15 minute chart we see that the downside ABC structure can be counted as complete, with five waves down in C. Also, the last low was formed with positive divergence on the MACD indicator (higher low while price gets a lower low, usually indicative of a bottom).
Trying to find a bottom can be frustrating and costly, and it also requires nerves of steel and FUD resistance. But it can be a very profitable skill to master. As a member on a site I'm a member of put it:
I hate watching for bottoms. It's like baking. You get the oven preheated, make sure all the ingredients are right, place it in the oven, and wait patiently... Got the oven light on and everything. Standing there all bent over waiting for something to happen. ...and even after that sometimes the cake still falls flat. I guess you just hope that over time you end up with more good cakes than bad ones.
So watch out for your cake to fall flat! Set stops! Know when the setup you're trading invalidates!


BTC is headed down imho
OML possible for sure, if we get another 4-5.