Bitcoin Short Term Analysis February 5th, 2020
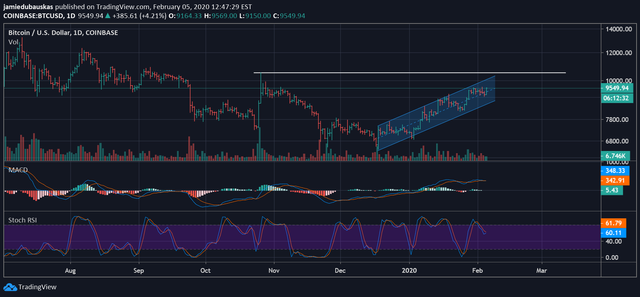
Here is a small analysis for BTC/USD on a daily chart.
Within the next week or so I am fully expecting Bitcoin to retest the previous resistance zone of $10,200-$10,500 range (depending on what exchange you are trading on) that was previously made on October 26th, 2019. Now the 4% pump from today confirms that this is all the more possible. It can either be a slow grind to the resistance zone or once the previous 2020 high of $9,620 is surpassed, it can be a straight shot upwards towards the zone.
If Bitcoin can break above the resistance zone in a quick move, the next target will be $12,300 which was made a resistance level on August 6th, 2019.
I expect the next month or so to be very exciting for Bitcoin. Hodl on!
If you liked this analysis, upvote & go subscribe to my podcast on YouTube where I post weekly market updates and crypto news: https://www.youtube.com/channel/UC8i0EY5M_9NKdYMnS2Y0yqw
Update: Zooming in further, Bitcoin has made some great advancements towards the psychological level of $10k. Bitcoin is forming a clear bull flag on the 30 minute chart with the Stochastic RSI showing really bullish buy signals