Bitcoin (BTC): Daily Price Action (Fri, 06-Apr-2018)
For education purposes only.
Price (Down)
Following on from yesterday's review (here) the BTC price consolidated at the ascending trendline (green thick line) indicating it was finding some decent support, however, today it has broken down somewhat and is currently trading at $6,570 (Bitfinex).
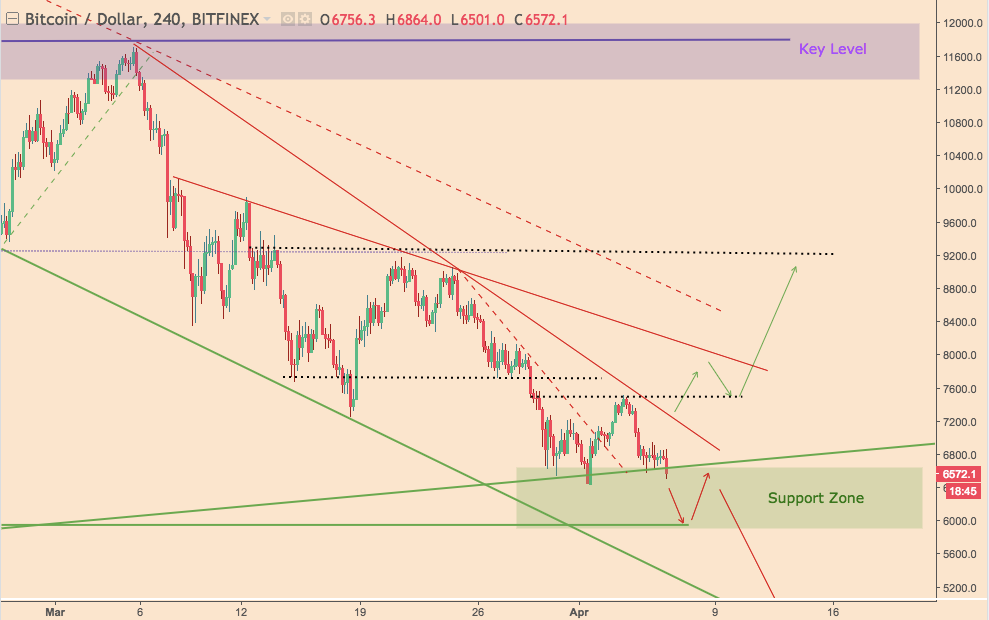
On the current 4hr candle, the market appears to be rejecting a further move down, however, the price structure looks weak and could be vulnerable to reaching the $6,000 mark.
If however, the price can hold above the previous lows (of about $6,400) and rally above the previous highs ($7,500), this would represents a relatively clean completed double-bottom pattern, that may signal a reversal.
However a word of warning there have been a couple of false reversal signals over the past few weeks: these chart patterns only have a probability of being successful, the market is going to go where the market wants to go, so it's important to wait for some kind of confirmation (such as the price making a higher-high and higher-low, for instance), before considering a long trade (even if you think the market can't go lower...it can.)
Bias (Neutral)
Back to Neutral I'm afraid until the market starts doing something more convincing - however, it could be creating price structure from which the next move will be projected.
Until tomorrow,
Bobby