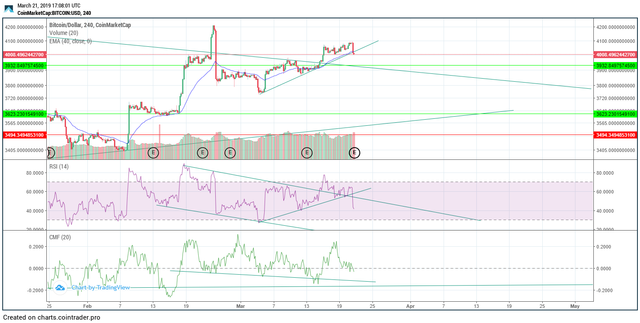
BTC'S bearish momentum back or simply a small correction?
Last week we have shared with you a bearish scenario for a BTC. To our surprise, what we expected didn’t happen. The BTC managed to break out of the pattern on the relatively high volume, which normally would be a bullish sign. Though after the price tried to push above the breakout high, the volume dropped and soon the price followed with 4-hour candle closing below the trendline. We believe that it’s now important to clarify what are the possible outcomes of this sudden change. As of now, even though price might get a little higher once people start closing their altcoin positions back into the BTC, we may be almost certain that the upper border of the pattern will be tested for a support. From that point two scenarios could crystalize. If the 4-hour candle manages to close on high volume below the blue upper structure of the pattern, it’s very likely that the price will drop to the levels of the bottom trend line. In that case, if your position is generally bullish, bottom trend line of the pattern could provide a good long-term entry with stop loss few hundreds below the trend line. The second scenario is that the upper trend line of the pattern will hold, and the price will continue its upward surge. In that case make sure to put stop loss again few hundreds below the upper trend line, since if that one is broken, odds are in the favor of retesting the bottom trend line. In any way, we wish you a strong nerve in these uncertain volatile times, and good luck while trading.
In case you went short, don't forget to set up a stop loss on 4097 btc/usdt on Binance. As always, nothing is for certain, and if we were in actual break out, it would be bad to miss it, what's more, loose on it.