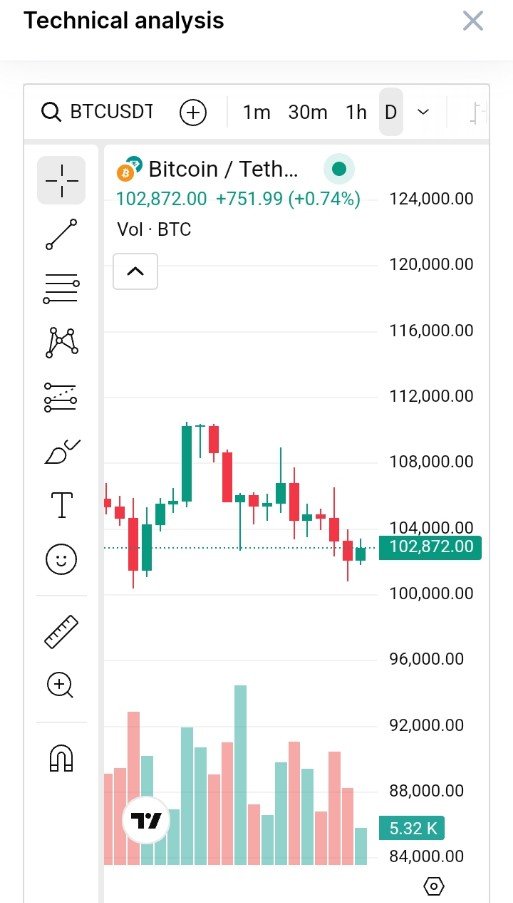
Latest snapshot of Bitcoin (BTC) price and key technical levels
Here’s the latest snapshot of Bitcoin (BTC) price and key technical levels:
📊 Bitcoin Price Summary
Current price: ≈ $102,860 USD
Day’s range: $101,183 – $103,983
Year-to-date: Up ~13.5% for 2025
🔑 Support & Resistance Levels
- Immediate Support
$100,000 — A critical psychological floor: multiple analysts (e.g., Mihir/RhythmicAnalyst) see this as key support—breaking below could lead to $95K
$101,957 — Barchart’s 1st support level
$100,170 — Barchart’s 2nd support level
$97,912 — Barchart’s 3rd support level
- Immediate Resistance
$106,000 – $106,002 — Barchart’s 1st resistance
$108,260 — Barchart’s 2nd resistance
$110,046 — Barchart’s 3rd resistance
$110,400 – $112,000 — Noted as a supply zone and psychological ceiling by multiple sources
$112,000 — Historical all-time high from May 22, 2025
📈 Technical Context & Implications
Consolidation phase around $100K–$105K:
BTC has been range-bound between $100K (support) and $105K (resistance), with tight Bollinger Bands and neutral RSI (~48), indicating a buildup before a big move .
Macro and geopolitical dynamics:
Support holds as long as Middle Eastern tensions don’t escalate—a deterioration could push BTC below $100K .
On-chain supply zone:
A high-volume supply cluster lies in the $95.5K–$97K range, a strong support zone, as short-term holders break even around $98K .
Potential downside trigger:
A break below $100K could lead to a test of next support around $95K .
Upside scenarios:
A break above $106K unlocks the path to $108K–$110K, with $112K serving as the critical ceiling—surpassing it could open a rally toward $120K+ .
Moving average signals:
Some fear of a "death cross" (50‑DMA crossing below 200‑DMA) looms, which could drag BTC back to $73.8K—but this is still being watched closely .
🧭 Levels at a Glance
Level Price ($) Role
Resistance 106,000 Short-term ceiling
108,260 Mid-range resistance
110,400–112,000 High supply zone, ATH level
Support 101,957 Short-term support
100,000 Key psychological & technical floor
100,170 Secondary support
~97,900 Strong bottom support
🎯 Strategy Implications
Bullish scenario:
Break above $106K → $110K → $112K could open momentum toward $120K+ .
Bearish scenario:
Drop below $100K → $95K → potential revisit of supply cluster at $95K–$97K .
Monitoring tools:
Pay attention to volume breakouts, RSI momentum, MACD crossovers, and on‑chain holder activity for confirmation of moves.
✅ Summary
Bitcoin remains range-bound in a tight zone between $100K and $106K. A breakout above could unlock a rally to $110K–$112K and beyond, while a breakdown risks revisiting $95K–$97K. Traders and holders should watch volume, macro events, and technical indicators for next triggers.
Let me know if you'd like intraday pivot point levels or deeper breakdowns on any timeframe!
