#BTC
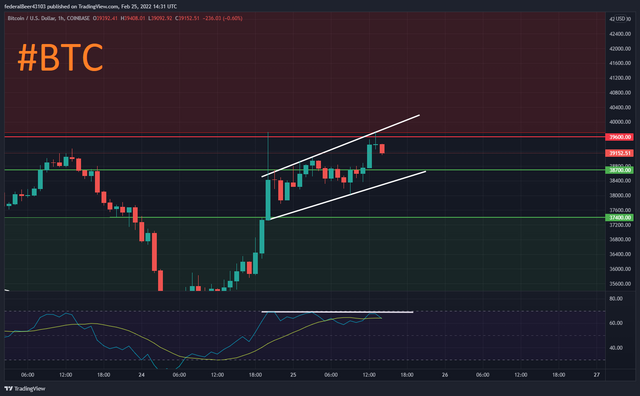
Bitcoin, as I didn't expect, shot up to 39,600 since yesterday, where there was quite a lot of liquidity and the price was pushed down.
At the moment, there is a minor bullish channel on the indicative 1h chart, which we are following perfectly and respecting the support and resistance levels here. The bullish channel, usually respects the higher low and high, but this must also be true in the case of the RSI, where I see a bearish divergence (chart rising, RSI standing still or declining. Both of these factors must be followed, otherwise a decline or pump usually follows, depending on the divergence) - hence a possible decline.
Important resistance: 39.600, 40.300
I personally don't expect much more buying, rather a pullback, if only because the 37.400 level has not been confirmed as support at all and for BTC, it would be good to go for at least one more look at this level. Alternatively, the 37,400 value may not serve as support at all, due to the backwardation not being confirmed.
