2018 16 May Bitcoin vs USD Price Analysis।। Post By ~ GPA (Steemlog#58)
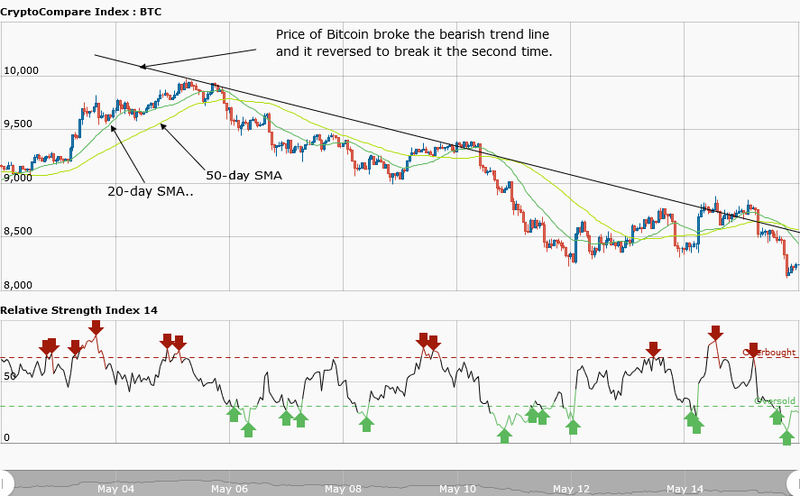
Yesterday, May 15, the BTCUSD pair traded above the $8,500 price level and, at the same time, the bearish trend line was broken. Secondly, the candlestick also closed on the opposite of the trend line. The price action also showed that the price retouched the trend line and began a ranged bound movement. Based of that, it was assumed that the downtrend was over.
It was previously stated that Bitcoin price is unlikely to continue its downtrend. Today, the price was trading at $8,341.68 at the time of writing. However, the weekly chart shows that it fell again to the previous day's low of $8,341.68. Nevertheless, if the asset continues its fall, it will certainly retest the previous low of $8,000.
The relative strength index period 14 is level 27 indicating that the market is oversold. This suggests that the bulls will take control of the market. However, that does not mean the price will not retest the previous low of $8,000 because it can rally even at the oversold market condition.
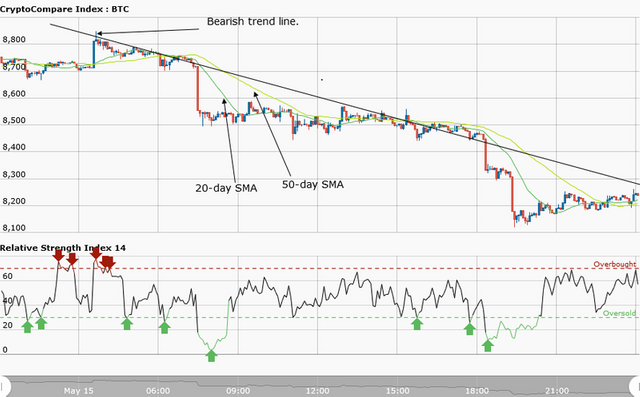
The daily chart shows that Bitcoin price has a bearish outlook. Yesterday, the asset was trading at $8,700 in a range bound movement. Later, the price fell to $8,500 and resumed its range bound movement. Bitcoin finally fell to $8,300. Since the price has broken the $8,500 level, it may find support at $8,000.