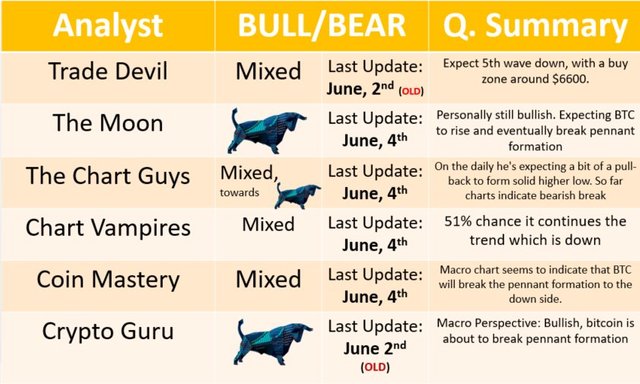
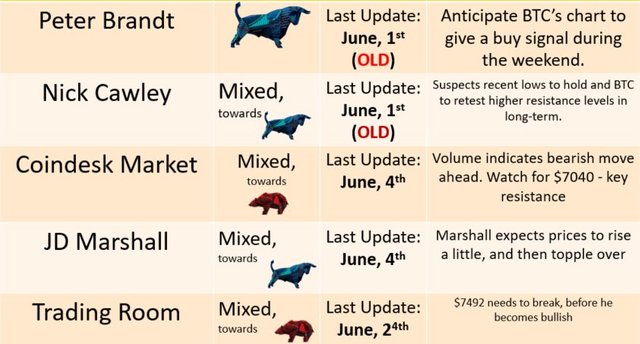
BTC TA - ANALYSTS DAILY SUMMARY - JUNE, 4th

JD Marshall (20 hours old)
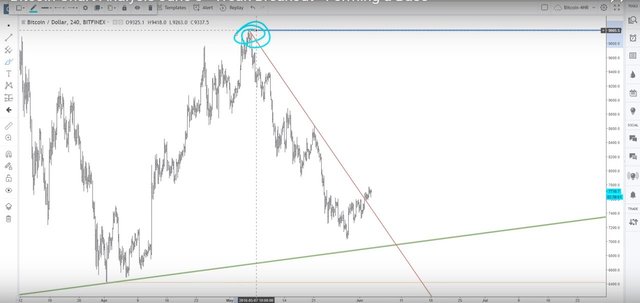
BTC is staying above the green line (macro bullish trend). BTC has also broken the short term bearish channel (red line).
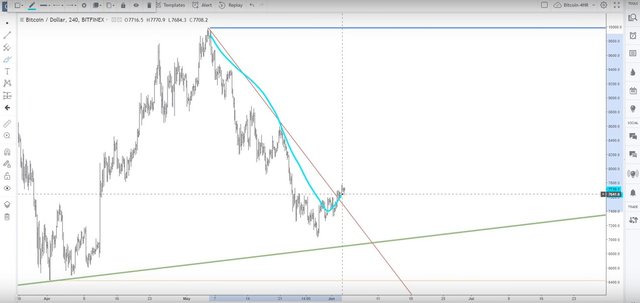
Marshall expects prices to rise a little, and then topple over. The big question is whether BTC will break the green line (chart below) at around $6950. Breaking the green line will be very bearish.
Marshall does not believe that the recent high around the $9900 level will be broken according to the charts. His macro thesis of BTC flatting out and building more energy for higher higs in THE FUTURE is still on the table.
@chartguys
The bullish weekly reversal candle looks good. However, the chart indicate that BTC is 10% away from a bearish break. Personally and based on fundamentals he's believing for break to the upside, but thus far the chart are showing we're going lower. As of writing he's not 100% sure of the BTC directional pattern and more time is needed to confirm the break that's coming.
On the daily he's expecting a bit of a pull-back to form solid higher low. Resistance to look at is around $7777. The past few days the bulls have kept their ground. Bear breaks are met with bullish buying forming many red candles with long wicks - indicating bullish buying when the bear breaks occur.
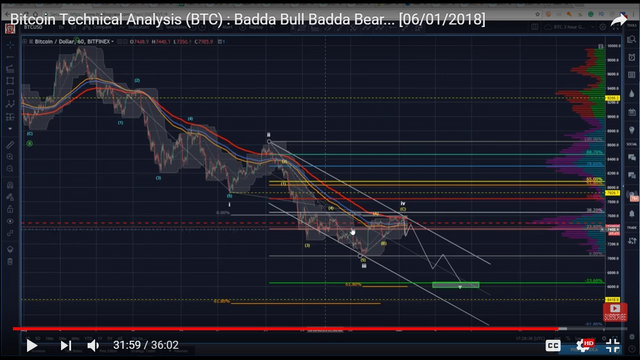
The Moon
The triple bottom form the pennant formation's bottom is still a bullish indicator. Also, the fact that BTC reversed after the triple bottom is bullish.
Using the Fibonacci Retracement Tool from the recent swing low to high - from the recent 7k triple bottom level to the recent high, reveals resistance and support for BTC, which might be a clear indication of algorithm trading and recent 'Bart Simpson' phenomena in BTC.
All in all The Moon is bullish and interpret that BTC is in a bullish uptrend.
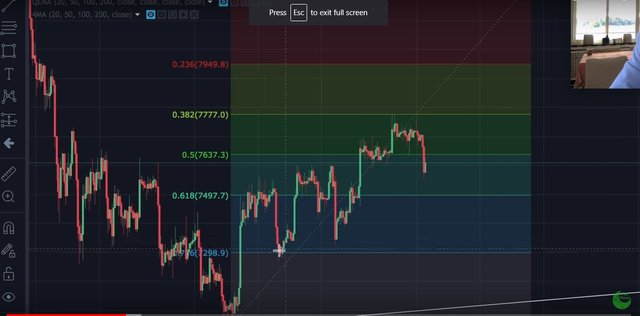
A bearish indicator might be the ascending wedge in BTC, which might be an indicator of coming correction.
Coin Mastery
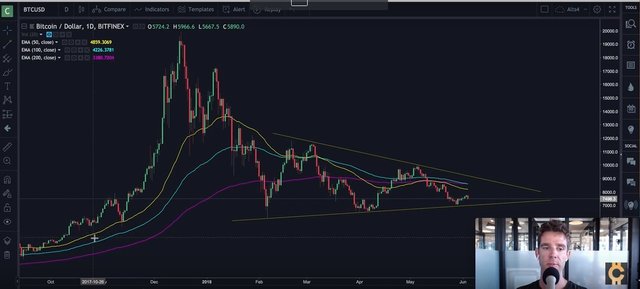
We've seen a big drop-off in the last 24 hours. The macro chart seems to indicate that BTC will break the pennant formation to the down side. Statistically he does not see BTC making any major moves to the downside or upside. He anticipates a slow grind for a while and some sideways trading.
All the EMA's are converging (see chart below), which is an indicator that big moves won't happen.
@tradedevil (NO NEW UPDATE)
Primary Bullish Count: BTC just finished 4th wave, expect 5th wave down, with a buy zone around $6600.
Secondary Bearish Count: BTC just finished a 1,2 Wave, which will indicate much lower prices. More clarity will emerge during the weekend.
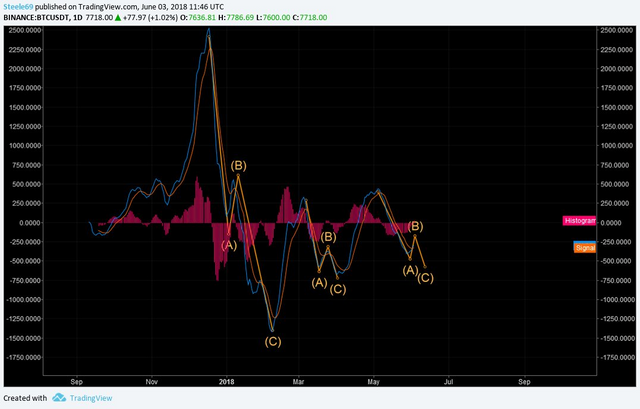
chris L $ChartVampire$
He also did a MACD analysis with the following comments:
1- 51% chance it continues the trend which is down
2- A continuation down is supposedly a smaller fall
3- If this breaks up it breaks up Hard and we'll see a bull run to 10k
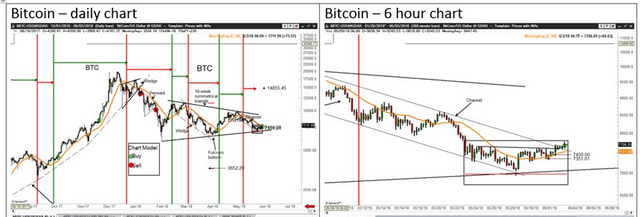
Peter Brandt
Bitcoin held the bottom of the large symmetrical triangle; the small H&S bottom and channel completed on 6-hr chart; The trend model for BTC remains down in his opinion.
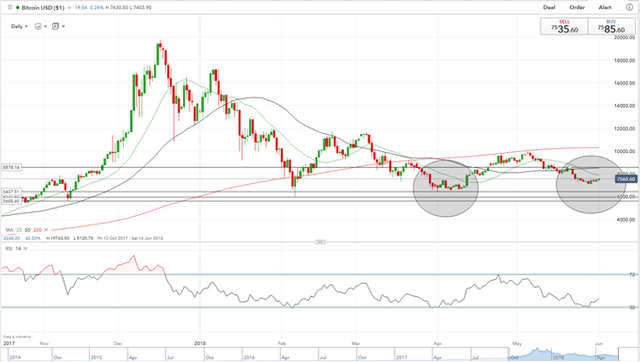
Nick Cawley (NO NEW UPDATE)
The largest cryptocurrency ends the week marginally higher and is currently building a base for a potential move higher, while the RSI indicator sees BTC bouncing back from oversold territory. BTC has good support between $5603 and $6438 and is unlikely to threaten support in the short-term – all things being equal. On the upside $8578 looks a likely first target before the coin re-tests the recent the recent high just above $10,000.
Trading Room
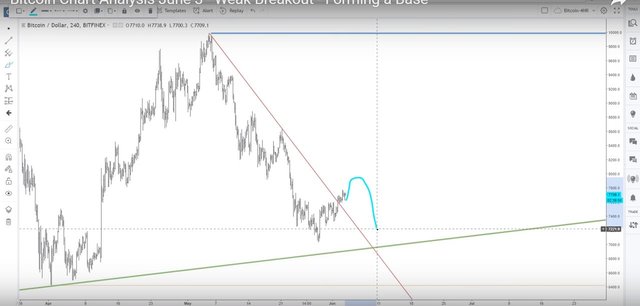
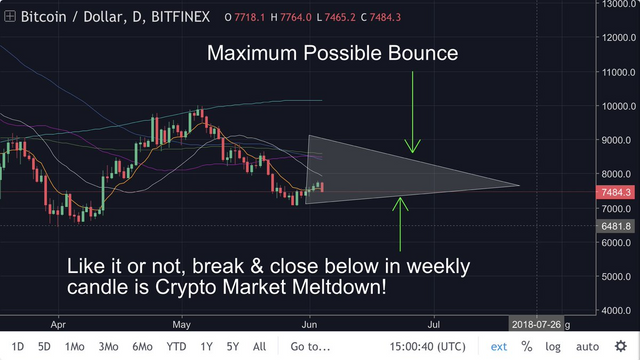
Trading Room's current sentiment is bearish. He'll become more bullish if he sees BTC breaking the triangle (chart below). For those long on BTC he comments that the $7942 is hard resistance which needs to break, if BTC is to go higher.
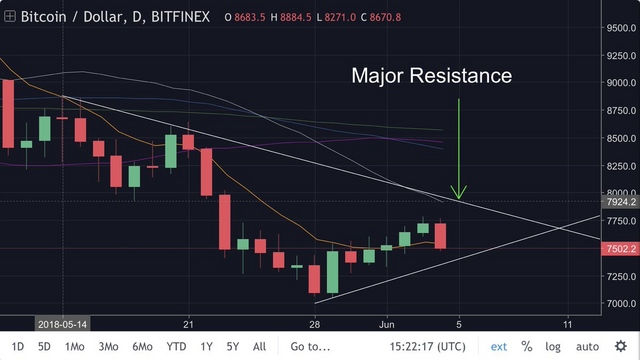
Bull case scenario is possible if BTC breaks the triangle on the upside. His logic for breakdown on the downside is based on weekly/monthly breakdown of key MAs coupled with overheating of ICO Markets & irrational exuberance.
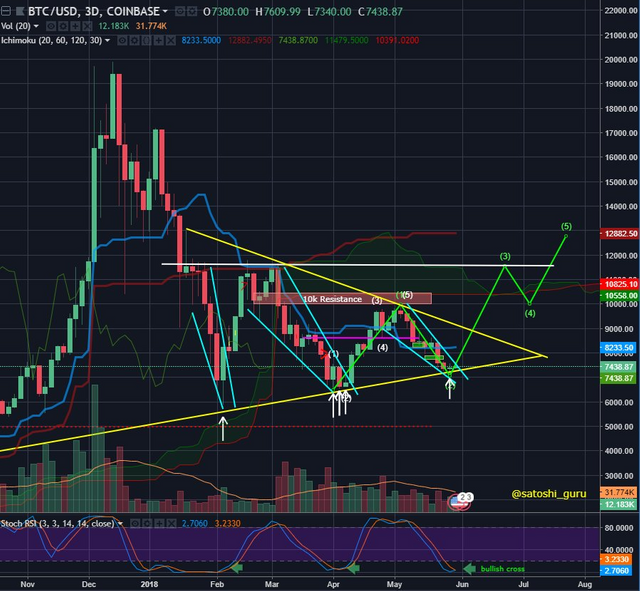
Crypto Guru (NO NEW UPDATE)
Commentary below: FYI CryptoGuru's count seems similar to @tradedevil . Definitely something to keep an eye on.
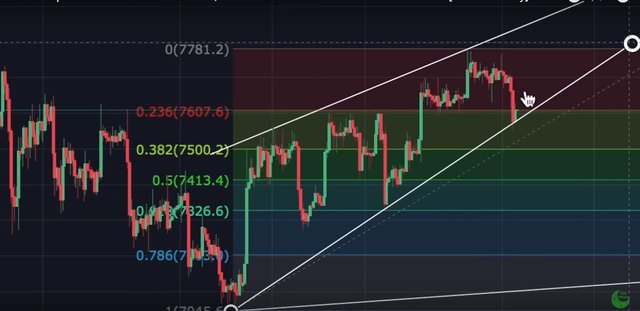
Mini Falling Wedge (teal) within a Massive Wedge (yellow). We faced the same exact situation at the start of Feb & April; except this time he believe we're ready to break through the Massive Yellow Wedge.
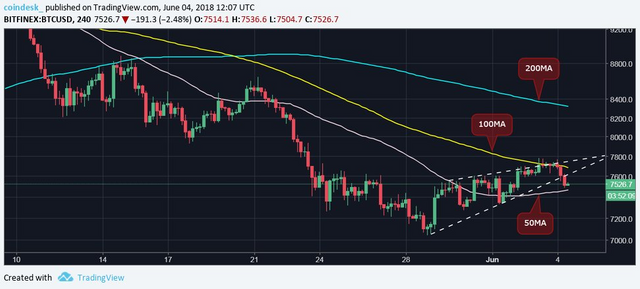
Coindesk Markets
Comments on recent BTC trading activity: Volume tends to rise every time #BTC creates a red candle - not a good sign. Meanwhile, volume remains low during upticks.
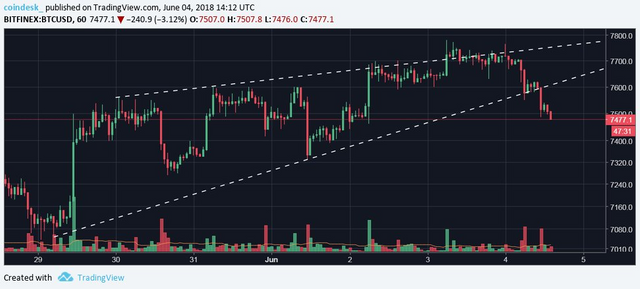
Bitcoin's 4-hour chart shows a rising wedge breakdown - a bearish reversal pattern. So BTC could be heading back to last week's low of $7,040. The bulls need to defend 50MA support lined up at $7,465.
Also, a shout out to @famunger for his daily Analyst Summaries.