Latest Monte Carlo Simulations of Bitcoin Price 100 Days Out
Just for fun, I've developed a monte carlo simulator for Bitcoin (or really it can be used for any empirical distribution).
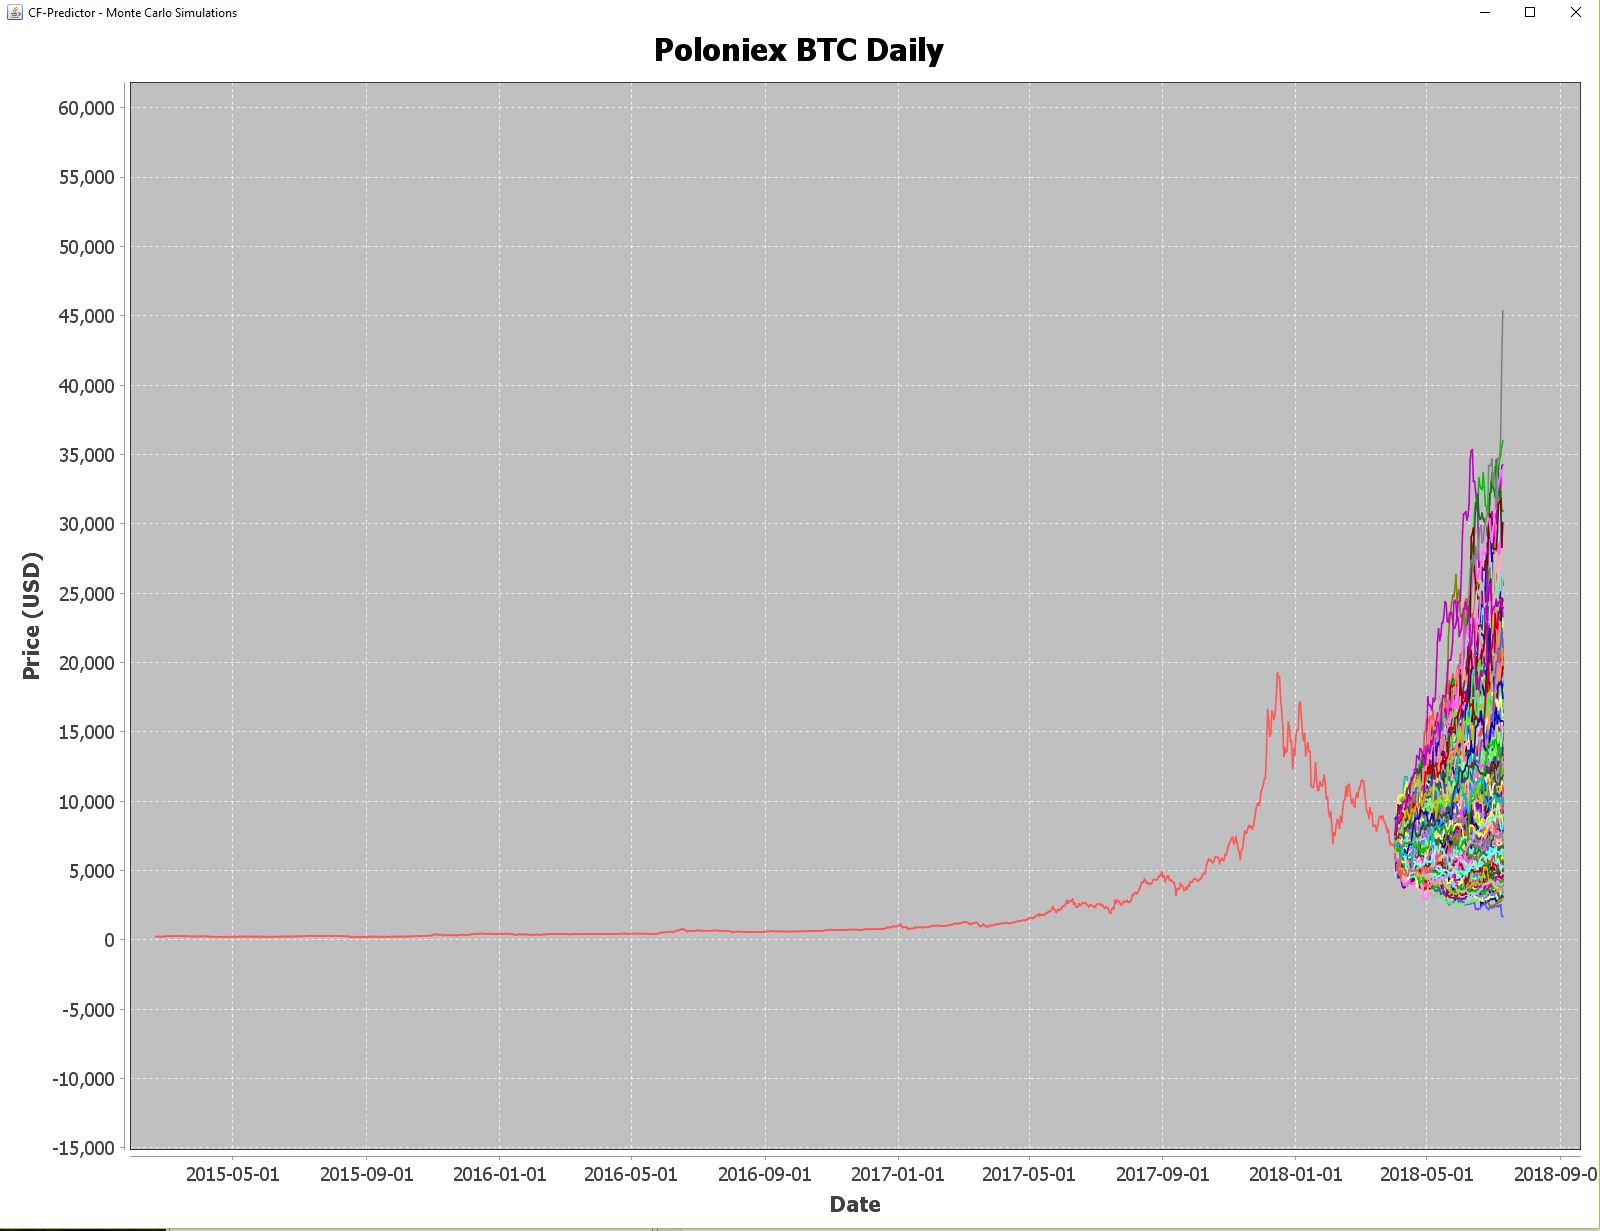
Simulating 1000 random walks out to 7.11.2018 produces the following "prediction":
1000 random walks ending on 2018-07-11T00:00Z
- Average Close Price: 10297.871828929912
- Median Close Price: 9580.614030757966
- Max Close Price: 31071.8910745536
- Min Close Price: 2277.196877248253
- 80th Percentile Close Price: 13531.952141619598
Which can be visualized by this chart:
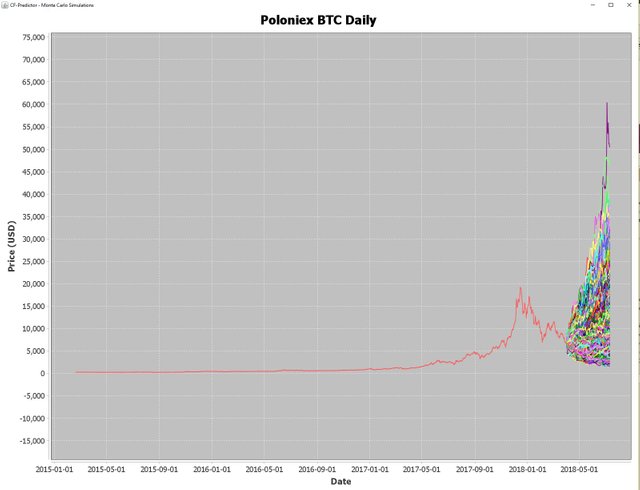
I also ran 10,000 random walks (all hail the Threadripper) with the following results:
10000 random walks ending on 2018-07-11T00:00Z
- Average Close Price: 10253.35880964114
- Median Close Price: 9389.700623245808
- Max Close Price: 50481.52524964556
- Min Close Price: 1586.7458787213823
- 80th Percentile Close Price: 13445.03327374023
Again, this was just for fun so don't go betting your home equity on it!
Hi
Help for beginners
Read my last post to get bis 45 free upvotes. 👇
https://c3k93.app.goo.gl/i/o11fX